Dollar General 2010 Annual Report Download - page 118
Download and view the complete annual report
Please find page 118 of the 2010 Dollar General annual report below. You can navigate through the pages in the report by either clicking on the pages listed below, or by using the keyword search tool below to find specific information within the annual report.-
 1
1 -
2
-
3
-
4
-
5
-
6
-
7
-
8
-
9
-
10
-
11
-
12
-
13
-
14
-
15
-
16
-
17
-
18
-
19
-
20
-
21
-
22
-
23
-
24
-
25
-
26
-
27
-
28
-
29
-
30
-
31
-
32
-
33
-
34
-
35
-
36
-
37
-
38
-
39
-
40
-
41
-
42
-
43
-
44
-
45
-
46
-
47
-
48
-
49
-
50
-
51
-
52
-
53
-
54
-
55
-
56
-
57
-
58
-
59
-
60
-
61
-
62
-
63
-
64
-
65
-
66
-
67
-
68
-
69
-
70
-
71
-
72
-
73
-
74
-
75
-
76
-
77
-
78
-
79
-
80
-
81
-
82
-
83
-
84
-
85
-
86
-
87
-
88
-
89
-
90
-
91
-
92
-
93
-
94
-
95
-
96
-
97
-
98
-
99
-
100
-
101
-
102
-
103
-
104
-
105
-
106
-
107
-
 108
108 -
 109
109 -
 110
110 -
 111
111 -
 112
112 -
 113
113 -
 114
114 -
 115
115 -
 116
116 -
 117
117 -
 118
118 -
 119
119 -
 120
120 -
 121
121 -
 122
122 -
 123
123 -
 124
124 -
 125
125 -
 126
126 -
 127
127 -
 128
128 -
129
-
130
-
131
-
132
-
133
-
134
-
135
-
136
-
137
-
138
-
139
-
140
-
141
-
142
-
143
-
144
-
145
-
146
-
147
-
148
-
149
-
150
-
151
-
152
-
153
-
154
-
155
-
156
-
157
-
158
-
159
-
160
-
161
-
162
-
163
-
164
-
165
-
166
-
167
-
168
-
169
-
170
-
171
-
172
-
173
-
174
-
175
-
176
-
177
-
178
-
179
-
180
-
181
-
182
-
183
-
184
-
185
-
186
-
187
-
188
-
189
-
190
-
191
-
192
-
193
-
194
-
195
-
196
 |
 |

10-K
Our presentation of EBITDA and Adjusted EBITDA has limitations as an analytical tool, and
should not be considered in isolation or as a substitute for analysis of our results as reported under
U.S. GAAP. Because not all companies use identical calculations, these presentations of EBITDA and
Adjusted EBITDA may not be comparable to other similarly titled measures of other companies. We
believe that the presentation of EBITDA and Adjusted EBITDA is appropriate to provide additional
information about the calculation of this financial ratio in the Credit Facilities. Adjusted EBITDA is a
material component of this ratio. Specifically, non-compliance with the senior secured indebtedness
ratio contained in our Credit Facilities could prohibit us, subject to specified exceptions, from making
investments, incurring liens, making certain restricted payments and incurring additional secured
indebtedness (other than the additional funding provided for under the senior secured credit
agreement).
The calculation of Adjusted EBITDA under the Credit Facilities is as follows:
Year Ended
January 28, January 29,
2011 2010
(in millions)
Net income .................................... $ 627.9 $ 339.4
Add (subtract):
Interest income ................................ (0.2) (0.1)
Interest expense ............................... 274.1 345.6
Depreciation and amortization ..................... 242.3 241.7
Income taxes .................................. 357.1 212.7
EBITDA ...................................... 1,501.2 1,139.3
Adjustments:
Loss on debt retirements ......................... 14.6 55.3
Loss on hedging instruments ...................... 0.4 0.5
Impact of markdowns related to inventory clearance
activities, net of purchase accounting adjustments ..... — (7.3)
Advisory and consulting fees to affiliates .............. 0.1 63.5
Non-cash expense for share-based awards ............. 16.0 18.7
Indirect merger-related costs ...................... 1.3 10.6
Other non-cash charges (including LIFO) ............. 11.5 6.6
Total Adjustments ................................ 43.9 147.9
Adjusted EBITDA ............................... $1,545.1 $1,287.2
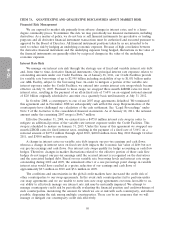
Interest Rate Swaps
We use interest rate swaps to minimize the risk of adverse changes in interest rates. These swaps
are intended to reduce risk by hedging an underlying economic exposure. Because of high correlation
between the derivative financial instrument and the underlying exposure being hedged, fluctuations in
the value of the financial instruments are generally offset by reciprocal changes in the value of the
underlying economic exposure. Our principal interest rate exposure relates to outstanding amounts
under our Credit Facilities. At January 28, 2011, we had interest rate swaps with a total notional
amount of approximately $1.05 billion. For more information see Item 7A ‘‘Quantitative and
Qualitative Disclosures about Market Risk’’ below.
40