Dollar General 2010 Annual Report Download - page 107
Download and view the complete annual report
Please find page 107 of the 2010 Dollar General annual report below. You can navigate through the pages in the report by either clicking on the pages listed below, or by using the keyword search tool below to find specific information within the annual report.-
 1
1 -
2
-
3
-
4
-
5
-
6
-
7
-
8
-
9
-
10
-
11
-
12
-
13
-
14
-
15
-
16
-
17
-
18
-
19
-
20
-
21
-
22
-
23
-
24
-
25
-
26
-
27
-
28
-
29
-
30
-
31
-
32
-
33
-
34
-
35
-
36
-
37
-
38
-
39
-
40
-
41
-
42
-
43
-
44
-
45
-
46
-
47
-
48
-
49
-
50
-
51
-
52
-
53
-
54
-
55
-
56
-
57
-
58
-
59
-
60
-
61
-
62
-
63
-
64
-
65
-
66
-
67
-
68
-
69
-
70
-
71
-
72
-
73
-
74
-
75
-
76
-
77
-
78
-
79
-
80
-
81
-
82
-
83
-
84
-
85
-
86
-
87
-
88
-
89
-
90
-
91
-
92
-
93
-
94
-
95
-
96
-
 97
97 -
 98
98 -
 99
99 -
 100
100 -
 101
101 -
 102
102 -
 103
103 -
 104
104 -
 105
105 -
 106
106 -
 107
107 -
 108
108 -
 109
109 -
 110
110 -
 111
111 -
 112
112 -
 113
113 -
 114
114 -
 115
115 -
 116
116 -
 117
117 -
118
-
119
-
120
-
121
-
122
-
123
-
124
-
125
-
126
-
127
-
128
-
129
-
130
-
131
-
132
-
133
-
134
-
135
-
136
-
137
-
138
-
139
-
140
-
141
-
142
-
143
-
144
-
145
-
146
-
147
-
148
-
149
-
150
-
151
-
152
-
153
-
154
-
155
-
156
-
157
-
158
-
159
-
160
-
161
-
162
-
163
-
164
-
165
-
166
-
167
-
168
-
169
-
170
-
171
-
172
-
173
-
174
-
175
-
176
-
177
-
178
-
179
-
180
-
181
-
182
-
183
-
184
-
185
-
186
-
187
-
188
-
189
-
190
-
191
-
192
-
193
-
194
-
195
-
196
 |
 |

10-K
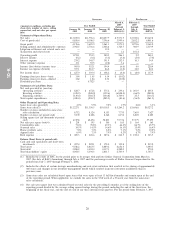
For the year ended January 28, 2011, our continued focus on our four priorities resulted in
improved financial performance over the year ended January 29, 2010 in each of our key financial
metrics, as follows. Basis points, as referred to below, are equal to 0.01 percent of total sales.
• Total sales in fiscal 2010 increased 10.5 percent over 2009. Sales in same-stores increased
4.9 percent, following a strong 9.5 percent increase in 2009. Customer traffic and average
transaction amount increased in both 2010 and 2009. Average sales per square foot in 2010 were
$201, up from $195 in 2009.
• Gross profit, as a percentage of sales, was 32.0 percent in 2010, an increase of 76 basis points
over 2009. This improvement was primarily attributable to increased purchase markups, net of
increased markdowns, resulting from increased volume, which enabled us to lower our average
costs from vendors. The improvement also reflected the continued impact of our comprehensive
category management enhancements.
• SG&A, as a percentage of sales, for fiscal 2010 was 22.3 percent compared to 23.2 percent in
2009. SG&A in 2009 included incremental expenses of $68.3 million, or 58 basis points, resulting
from the termination of our sponsor advisory agreement and the accelerated vesting of certain
equity-based compensation related to our initial public offering. SG&A in 2010 included
incremental expenses of $19.7 million, or 15 basis points, resulting from costs related to two
secondary offerings of our common stock during the year by certain of our shareholders.
Excluding the impact of these costs, SG&A, as a percentage of sales declined primarily due to
lower employee incentive compensation, which is based on financial targets set at the beginning
of each fiscal year (our results exceeded those targets in 2010 but not to the same degree as in
2009), lower healthcare expense, and the impact of other cost reduction and productivity
initiatives which resulted in various expenses decreasing or increasing at a rate lower than the
10.5 percent increase in sales.
• Interest expense decreased by $71.5 million in 2010 to $274.2 million, primarily as the result of
lower average outstanding long-term obligations. Net proceeds from our initial public offering
and excess cash were utilized in our fiscal 2009 fourth quarter to voluntarily reduce long-term
obligations by $725.9 million, and in 2010 we repurchased an additional $115.0 million of
long-term obligations utilizing operating cash flow. Other non-operating expenses include
charges totaling $14.7 million in 2010 and $55.3 million in 2009 resulting from these repurchases.
• We reported net income of $627.9 million, or $1.82 per diluted share, for fiscal 2010, compared
to net income of $339.4 million, or $1.04 per diluted share, in 2009. Charges relating to
secondary stock offerings by certain of our shareholders, including the acceleration of certain
equity appreciation rights, and losses from the repurchase of long-term obligations, reduced 2010
net income by $21.3 million, or $0.06 per diluted share. In 2009, charges resulting from the
termination of our sponsor advisory agreement, the acceleration of certain equity-based
compensation and the repurchase of long-term obligations, related to or resulting from our
initial public offering, reduced net income by $82.9 million, or $0.26 per diluted share.
• We generated approximately $825 million of cash flows from operating activities in 2010, an
increase of over 22 percent compared to 2009. Cash flow was primarily utilized to support our
capital expenditures and repurchase long-term obligations.
• During 2010, we opened 600 new stores, remodeled or relocated 504 stores, and closed 56
stores, resulting in a store count of 9,372 on January 28, 2011.
As discussed in more detail below, in recent years, we have generated significant cash flows from
operating activities. We have used a portion of these cash flows to pay down debt and to invest in new
store growth through our traditional leased stores. During 2010 we made a strategic decision to
purchase certain of our leased stores. We believe that the current environment in the real estate
29