Dollar General 2010 Annual Report Download - page 83
Download and view the complete annual report
Please find page 83 of the 2010 Dollar General annual report below. You can navigate through the pages in the report by either clicking on the pages listed below, or by using the keyword search tool below to find specific information within the annual report.-
 1
1 -
2
-
3
-
4
-
5
-
6
-
7
-
8
-
9
-
10
-
11
-
12
-
13
-
14
-
15
-
16
-
17
-
18
-
19
-
20
-
21
-
22
-
23
-
24
-
25
-
26
-
27
-
28
-
29
-
30
-
31
-
32
-
33
-
34
-
35
-
36
-
37
-
38
-
39
-
40
-
41
-
42
-
43
-
44
-
45
-
46
-
47
-
48
-
49
-
50
-
51
-
52
-
53
-
54
-
55
-
56
-
57
-
58
-
59
-
60
-
61
-
62
-
63
-
64
-
65
-
66
-
67
-
68
-
69
-
70
-
71
-
72
-
 73
73 -
 74
74 -
 75
75 -
 76
76 -
 77
77 -
 78
78 -
 79
79 -
 80
80 -
 81
81 -
 82
82 -
 83
83 -
 84
84 -
 85
85 -
 86
86 -
 87
87 -
 88
88 -
 89
89 -
 90
90 -
 91
91 -
 92
92 -
 93
93 -
94
-
95
-
96
-
97
-
98
-
99
-
100
-
101
-
102
-
103
-
104
-
105
-
106
-
107
-
108
-
109
-
110
-
111
-
112
-
113
-
114
-
115
-
116
-
117
-
118
-
119
-
120
-
121
-
122
-
123
-
124
-
125
-
126
-
127
-
128
-
129
-
130
-
131
-
132
-
133
-
134
-
135
-
136
-
137
-
138
-
139
-
140
-
141
-
142
-
143
-
144
-
145
-
146
-
147
-
148
-
149
-
150
-
151
-
152
-
153
-
154
-
155
-
156
-
157
-
158
-
159
-
160
-
161
-
162
-
163
-
164
-
165
-
166
-
167
-
168
-
169
-
170
-
171
-
172
-
173
-
174
-
175
-
176
-
177
-
178
-
179
-
180
-
181
-
182
-
183
-
184
-
185
-
186
-
187
-
188
-
189
-
190
-
191
-
192
-
193
-
194
-
195
-
196
 |
 |

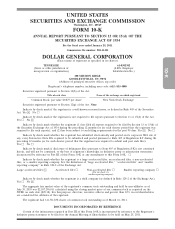
10-K
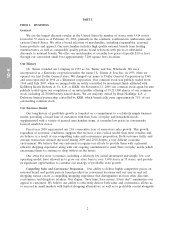
Growing Our Store Base. Based on a detailed, market-by-market analysis, we believe we have the
potential to at least double our current number of stores through expansion in both existing and new
markets. In 2011, we plan to enter three new states, Connecticut, New Hampshire and Nevada. We
have confidence in our real estate disciplines and in our ability to identify, open and operate successful
new stores. As a result, we believe that at least our present level of new store growth is sustainable for
the foreseeable future. In addition, we continue to believe that in the current real estate market
environment there may be opportunities to negotiate lower rent than would have previously been
available, allowing us to continue to improve the overall quality of our sites at attractive rental rates.
Our Merchandise
We offer a focused assortment of everyday necessities, which drive frequent customer visits, and
key items in a broad range of general merchandise categories. Our product assortment provides the
opportunity for our customers to address most of their basic shopping needs with one trip. We sell high
quality national brands from leading manufacturers such as Procter & Gamble, Kimberly Clark,
Unilever, Kellogg’s, General Mills, Nabisco, Coca-Cola and PepsiCo, which are typically found at
higher retail prices elsewhere. Additionally, our private brand selections offer consumers even greater
value with options to purchase value items and national brand equivalent products at substantial
discounts to the national brand.
Our stores generally offer approximately 10,000 total SKUs per store. The number of SKUs in a
given store can vary based upon the store’s size, geographic location, merchandising initiatives,
seasonality, and other factors. Most of our products are priced at $10 or less, with approximately 24%
at $1 or less. We separate our merchandise into four categories: 1) consumables; 2) seasonal; 3) home
products; and 4) apparel.
Consumables is our largest category and includes paper and cleaning products (such as paper
towels, bath tissue, paper dinnerware, trash and storage bags, laundry and other home cleaning
supplies); food, including packaged food and perishables (such as cereals, canned soups and vegetables,
sugar, flour, milk, eggs and bread); beverages and snacks (including candy, cookies, crackers, salty
snacks and carbonated beverages); health and beauty (including over-the-counter medicines and
personal care products, such as soap, body wash, shampoo, dental hygiene and foot care products); and
pet (including pet supplies and pet food).
Seasonal products include decorations, toys, batteries, small electronics, greeting cards, stationery,
prepaid cell phones and accessories, gardening supplies, hardware, automotive and home office
supplies.
Home products includes kitchen supplies, cookware, small appliances, light bulbs, storage
containers, frames, candles, craft supplies and kitchen, bed and bath soft goods.
Apparel includes casual everyday apparel for infants, toddlers, girls, boys, women and men, as well
as socks, underwear, disposable diapers, shoes and accessories.
The percentage of net sales of each of our four categories of merchandise for the fiscal years
indicated below was as follows:
2010 2009 2008
Consumables ...................................... 71.6% 70.8% 69.3%
Seasonal ......................................... 14.5% 14.5% 14.6%
Home products .................................... 7.0% 7.4% 8.2%
Apparel .......................................... 6.9% 7.3% 7.9%
Our home products and seasonal categories typically account for the highest gross profit margins,
and the consumables category typically accounts for the lowest gross profit margin.
5