Dollar General 2010 Annual Report Download - page 149
Download and view the complete annual report
Please find page 149 of the 2010 Dollar General annual report below. You can navigate through the pages in the report by either clicking on the pages listed below, or by using the keyword search tool below to find specific information within the annual report.-
 1
1 -
2
-
3
-
4
-
5
-
6
-
7
-
8
-
9
-
10
-
11
-
12
-
13
-
14
-
15
-
16
-
17
-
18
-
19
-
20
-
21
-
22
-
23
-
24
-
25
-
26
-
27
-
28
-
29
-
30
-
31
-
32
-
33
-
34
-
35
-
36
-
37
-
38
-
39
-
40
-
41
-
42
-
43
-
44
-
45
-
46
-
47
-
48
-
49
-
50
-
51
-
52
-
53
-
54
-
55
-
56
-
57
-
58
-
59
-
60
-
61
-
62
-
63
-
64
-
65
-
66
-
67
-
68
-
69
-
70
-
71
-
72
-
73
-
74
-
75
-
76
-
77
-
78
-
79
-
80
-
81
-
82
-
83
-
84
-
85
-
86
-
87
-
88
-
89
-
90
-
91
-
92
-
93
-
94
-
95
-
96
-
97
-
98
-
99
-
100
-
101
-
102
-
103
-
104
-
105
-
106
-
107
-
108
-
109
-
110
-
111
-
112
-
113
-
114
-
115
-
116
-
117
-
118
-
119
-
120
-
121
-
122
-
123
-
124
-
125
-
126
-
127
-
128
-
129
-
130
-
131
-
132
-
133
-
134
-
135
-
136
-
137
-
138
-
 139
139 -
 140
140 -
 141
141 -
 142
142 -
 143
143 -
 144
144 -
 145
145 -
 146
146 -
 147
147 -
 148
148 -
 149
149 -
 150
150 -
 151
151 -
 152
152 -
 153
153 -
 154
154 -
 155
155 -
 156
156 -
 157
157 -
 158
158 -
 159
159 -
160
-
161
-
162
-
163
-
164
-
165
-
166
-
167
-
168
-
169
-
170
-
171
-
172
-
173
-
174
-
175
-
176
-
177
-
178
-
179
-
180
-
181
-
182
-
183
-
184
-
185
-
186
-
187
-
188
-
189
-
190
-
191
-
192
-
193
-
194
-
195
-
196
 |
 |

10-K
DOLLAR GENERAL CORPORATION AND SUBSIDIARIES
NOTES TO CONSOLIDATED FINANCIAL STATEMENTS (Continued)
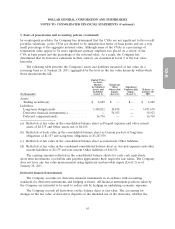
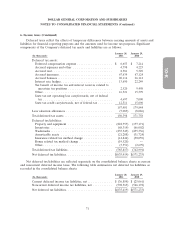
6. Income taxes (Continued)
Deferred taxes reflect the effects of temporary differences between carrying amounts of assets and
liabilities for financial reporting purposes and the amounts used for income tax purposes. Significant
components of the Company’s deferred tax assets and liabilities are as follows:
January 28, January 29,
(In thousands) 2011 2010
Deferred tax assets:
Deferred compensation expense .................... $ 6,653 $ 7,214
Accrued expenses and other ...................... 4,798 4,223
Accrued rent .................................. 8,581 5,329
Accrued insurance .............................. 67,634 67,124
Accrued bonuses ............................... 20,116 26,112
Interest rate hedges ............................. 13,650 22,249
Tax benefit of income tax and interest reserves related to
uncertain tax positions ......................... 2,520 9,498
Other ....................................... 16,321 15,399
State tax net operating loss carryforwards, net of federal
tax ....................................... 4,697 7,000
State tax credit carryforwards, net of federal tax ........ 12,511 15,696
157,481 179,844
Less valuation allowances .......................... (7,083) (8,086)
Total deferred tax assets ........................... 150,398 171,758
Deferred tax liabilities:
Property and equipment ......................... (222,757) (177,171)
Inventories ................................... (68,314) (66,002)
Trademarks ................................... (435,543) (435,336)
Amortizable assets ............................. (21,288) (31,724)
Insurance related tax method change ................ (14,844) (30,059)
Bonus related tax method change ................... (19,520) —
Other ....................................... (3,551) (2,699)
Total deferred tax liabilities ......................... (785,817) (742,991)
Net deferred tax liabilities .......................... $(635,419) $(571,233)
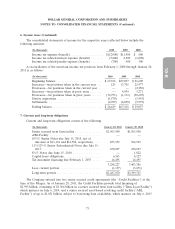
Net deferred tax liabilities are reflected separately on the consolidated balance sheets as current
and noncurrent deferred income taxes. The following table summarizes net deferred tax liabilities as
recorded in the consolidated balance sheets:
January 28, January 29,
(In thousands) 2011 2010
Current deferred income tax liabilities, net .............. $ (36,854) $ (25,061)
Noncurrent deferred income tax liabilities, net ........... (598,565) (546,172)
Net deferred tax liabilities .......................... $(635,419) $(571,233)
71