Dollar General 2010 Annual Report Download - page 165
Download and view the complete annual report
Please find page 165 of the 2010 Dollar General annual report below. You can navigate through the pages in the report by either clicking on the pages listed below, or by using the keyword search tool below to find specific information within the annual report.-
 1
1 -
2
-
3
-
4
-
5
-
6
-
7
-
8
-
9
-
10
-
11
-
12
-
13
-
14
-
15
-
16
-
17
-
18
-
19
-
20
-
21
-
22
-
23
-
24
-
25
-
26
-
27
-
28
-
29
-
30
-
31
-
32
-
33
-
34
-
35
-
36
-
37
-
38
-
39
-
40
-
41
-
42
-
43
-
44
-
45
-
46
-
47
-
48
-
49
-
50
-
51
-
52
-
53
-
54
-
55
-
56
-
57
-
58
-
59
-
60
-
61
-
62
-
63
-
64
-
65
-
66
-
67
-
68
-
69
-
70
-
71
-
72
-
73
-
74
-
75
-
76
-
77
-
78
-
79
-
80
-
81
-
82
-
83
-
84
-
85
-
86
-
87
-
88
-
89
-
90
-
91
-
92
-
93
-
94
-
95
-
96
-
97
-
98
-
99
-
100
-
101
-
102
-
103
-
104
-
105
-
106
-
107
-
108
-
109
-
110
-
111
-
112
-
113
-
114
-
115
-
116
-
117
-
118
-
119
-
120
-
121
-
122
-
123
-
124
-
125
-
126
-
127
-
128
-
129
-
130
-
131
-
132
-
133
-
134
-
135
-
136
-
137
-
138
-
139
-
140
-
141
-
142
-
143
-
144
-
145
-
146
-
147
-
148
-
149
-
150
-
151
-
152
-
153
-
154
-
 155
155 -
 156
156 -
 157
157 -
 158
158 -
 159
159 -
 160
160 -
 161
161 -
 162
162 -
 163
163 -
 164
164 -
 165
165 -
 166
166 -
 167
167 -
 168
168 -
 169
169 -
 170
170 -
 171
171 -
 172
172 -
 173
173 -
 174
174 -
 175
175 -
176
-
177
-
178
-
179
-
180
-
181
-
182
-
183
-
184
-
185
-
186
-
187
-
188
-
189
-
190
-
191
-
192
-
193
-
194
-
195
-
196
 |
 |

10-K
DOLLAR GENERAL CORPORATION AND SUBSIDIARIES
NOTES TO CONSOLIDATED FINANCIAL STATEMENTS (Continued)
11. Share-based payments (Continued)
net of tax) was related to equity appreciation rights and less than $0.1 million was related to restricted
stock units as discussed in more detail below.
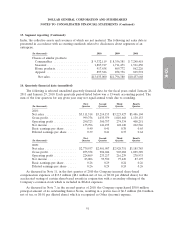
For the year ended January 29, 2010, the fair value method of accounting for share-based awards
resulted in share-based compensation expense (a component of SG&A expenses) and a corresponding
reduction in net income before income taxes in the amount of $22.2 million ($13.6 million net of tax)
of which $11.7 million ($7.1 million net of tax) was related to stock options, $7.2 million ($4.4 million
net of tax) was related to equity appreciation rights and $3.3 million ($2.0 million net of tax) was
related to restricted stock as discussed in more detail below. Of these amounts, $6.9 million of the
expense for equity appreciation rights and $2.5 million of the expense for restricted stock was
attributable to the vesting of certain awards in conjunction with the Company’s initial public offering.
For the year ended January 30, 2009, the Company recorded share-based compensation expense
and a corresponding reduction in net income before income taxes in the amount of $10.0 million
($6.1 million net of tax) of which $8.9 million ($5.4 million net of tax) was related to stock options and
$1.1 million ($0.7 million net of tax) was related to restricted stock.
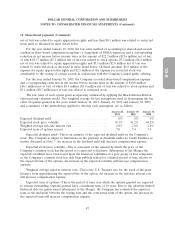
The fair value of each option grant is separately estimated by applying the Black-Scholes-Merton
option pricing valuation model. The weighted average for key assumptions used in determining the fair
value of options granted in the years ended January 28, 2011, January 29, 2010 and January 30, 2009,
and a summary of the methodology applied to develop each assumption, are as follows:
January 28, January 29, January 30,
2011 2010 2009
Expected dividend yield ................................ 0% 0% 0%
Expected stock price volatility ............................ 39.1% 41.2% 40.2%
Weighted average risk-free interest rate ..................... 2.8% 2.8% 2.8%
Expected term of options (years) ......................... 7.0 7.4 7.4
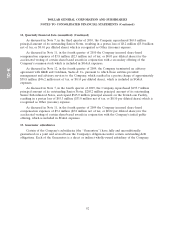
Expected dividend yield—This is an estimate of the expected dividend yield on the Company’s
stock. The Company is subject to limitations on the payment of dividends under its Credit Facilities as
further discussed in Note 7. An increase in the dividend yield will decrease compensation expense.
Expected stock price volatility—This is a measure of the amount by which the price of the
Company’s common stock has fluctuated or is expected to fluctuate. Subsequent to the Merger the
expected volatilities have been based upon the historical volatilities of a peer group of four companies,
as the Company’s common stock has only been publicly traded for a limited period of time relative to
the expected term of the options. An increase in the expected volatility will increase compensation
expense.
Weighted average risk-free interest rate—This is the U.S. Treasury rate for the week of the grant
having a term approximating the expected life of the option. An increase in the risk-free interest rate
will increase compensation expense.
Expected term of options—This is the period of time over which the options granted are expected
to remain outstanding. Options granted have a maximum term of 10 years. Due to the relatively limited
historical data for grants issued subsequent to the Merger, the Company has estimated the expected
term as the mid-point between the vesting date and the contractual term of the option. An increase in
the expected term will increase compensation expense.
87