Dollar General 2010 Annual Report Download - page 172
Download and view the complete annual report
Please find page 172 of the 2010 Dollar General annual report below. You can navigate through the pages in the report by either clicking on the pages listed below, or by using the keyword search tool below to find specific information within the annual report.-
 1
1 -
2
-
3
-
4
-
5
-
6
-
7
-
8
-
9
-
10
-
11
-
12
-
13
-
14
-
15
-
16
-
17
-
18
-
19
-
20
-
21
-
22
-
23
-
24
-
25
-
26
-
27
-
28
-
29
-
30
-
31
-
32
-
33
-
34
-
35
-
36
-
37
-
38
-
39
-
40
-
41
-
42
-
43
-
44
-
45
-
46
-
47
-
48
-
49
-
50
-
51
-
52
-
53
-
54
-
55
-
56
-
57
-
58
-
59
-
60
-
61
-
62
-
63
-
64
-
65
-
66
-
67
-
68
-
69
-
70
-
71
-
72
-
73
-
74
-
75
-
76
-
77
-
78
-
79
-
80
-
81
-
82
-
83
-
84
-
85
-
86
-
87
-
88
-
89
-
90
-
91
-
92
-
93
-
94
-
95
-
96
-
97
-
98
-
99
-
100
-
101
-
102
-
103
-
104
-
105
-
106
-
107
-
108
-
109
-
110
-
111
-
112
-
113
-
114
-
115
-
116
-
117
-
118
-
119
-
120
-
121
-
122
-
123
-
124
-
125
-
126
-
127
-
128
-
129
-
130
-
131
-
132
-
133
-
134
-
135
-
136
-
137
-
138
-
139
-
140
-
141
-
142
-
143
-
144
-
145
-
146
-
147
-
148
-
149
-
150
-
151
-
152
-
153
-
154
-
155
-
156
-
157
-
158
-
159
-
160
-
161
-
 162
162 -
 163
163 -
 164
164 -
 165
165 -
 166
166 -
 167
167 -
 168
168 -
 169
169 -
 170
170 -
 171
171 -
 172
172 -
 173
173 -
 174
174 -
 175
175 -
 176
176 -
 177
177 -
 178
178 -
 179
179 -
 180
180 -
 181
181 -
 182
182 -
183
-
184
-
185
-
186
-
187
-
188
-
189
-
190
-
191
-
192
-
193
-
194
-
195
-
196
 |
 |

10-K
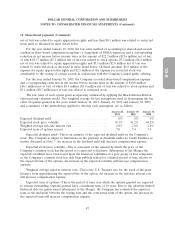
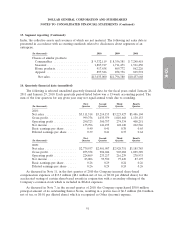
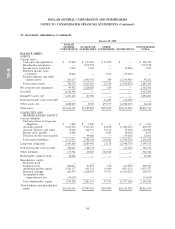
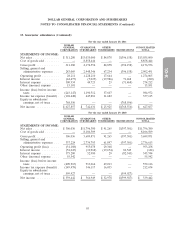
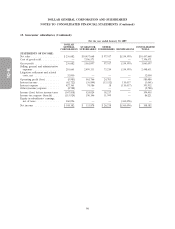
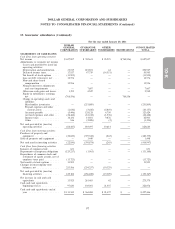
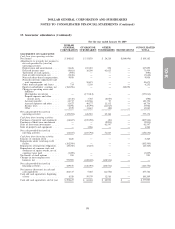
DOLLAR GENERAL CORPORATION AND SUBSIDIARIES
NOTES TO CONSOLIDATED FINANCIAL STATEMENTS (Continued)
15. Guarantor subsidiaries (Continued)
January 29, 2010
DOLLAR
GENERAL GUARANTOR OTHER CONSOLIDATED
CORPORATION SUBSIDIARIES SUBSIDIARIES ELIMINATIONS TOTAL
BALANCE SHEET:
ASSETS
Current assets:
Cash and cash equivalents . . . $ 97,620 $ 103,001 $ 21,455 $ — $ 222,076
Merchandise inventories ..... — 1,519,578 — — 1,519,578
Income taxes receivable ..... 9,924 1,645 — (4,026) 7,543
Deferred income taxes
receivable ............. 16,066 — 3,559 (19,625) —
Prepaid expenses and other
current assets .......... 625,157 3,040,792 704 (3,570,401) 96,252
Total current assets ........ 748,767 4,665,016 25,718 (3,594,052) 1,845,449
Net property and equipment . . . 99,452 1,228,829 105 — 1,328,386
Goodwill ................ 4,338,589 — — — 4,338,589
Intangible assets, net ........ 1,201,223 83,060 — — 1,284,283
Deferred income taxes receivable — — 36,405 (36,405) —
Other assets, net ........... 4,288,270 8,920 297,757 (4,528,135) 66,812
Total assets ............... $10,676,301 $5,985,825 $359,985 $(8,158,592) $8,863,519
LIABILITIES AND
SHAREHOLDERS’ EQUITY
Current liabilities:
Current portion of long-term
obligations ............ $ 1,822 $ 1,849 $ — $ — $ 3,671
Accounts payable ......... 3,033,723 1,311,063 46,818 (3,560,651) 830,953
Accrued expenses and other . . 72,320 226,571 53,149 (9,750) 342,290
Income taxes payable ....... 4,086 — 4,465 (4,026) 4,525
Deferred income taxes payable — 44,686 — (19,625) 25,061
Total current liabilities ...... 3,111,951 1,584,169 104,432 (3,594,052) 1,206,500
Long-term obligations ........ 3,645,820 2,689,492 13,178 (2,948,775) 3,399,715
Deferred income taxes payable . . 394,045 188,532 — (36,405) 546,172
Other liabilities ............ 115,701 40,065 146,582 — 302,348
Redeemable common stock .... 18,486 — — — 18,486
Shareholders’ equity:
Preferred stock ........... — — — — —
Common stock ........... 298,013 23,855 100 (23,955) 298,013
Additional paid-in capital .... 2,923,377 431,253 19,900 (451,153) 2,923,377
Retained earnings ......... 203,075 1,028,459 75,793 (1,104,252) 203,075
Accumulated other
comprehensive loss ....... (34,167) — — — (34,167)
Total shareholders’ equity .... 3,390,298 1,483,567 95,793 (1,579,360) 3,390,298
Total liabilities and shareholders’
equity ................. $10,676,301 $5,985,825 $359,985 $(8,158,592) $8,863,519
94