Capital One 2002 Annual Report Download - page 78
Download and view the complete annual report
Please find page 78 of the 2002 Capital One annual report below. You can navigate through the pages in the report by either clicking on the pages listed below, or by using the keyword search tool below to find specific information within the annual report.-
 1
1 -
2
-
3
-
4
-
5
-
6
-
7
-
8
-
9
-
10
-
11
-
12
-
13
-
14
-
15
-
16
-
17
-
18
-
19
-
20
-
21
-
22
-
23
-
24
-
25
-
26
-
27
-
28
-
29
-
30
-
31
-
32
-
33
-
34
-
35
-
36
-
37
-
38
-
39
-
40
-
41
-
42
-
43
-
44
-
45
-
46
-
47
-
48
-
49
-
50
-
51
-
52
-
53
-
54
-
55
-
56
-
57
-
58
-
59
-
60
-
61
-
62
-
63
-
64
-
65
-
66
-
67
-
 68
68 -
 69
69 -
 70
70 -
 71
71 -
 72
72 -
 73
73 -
 74
74 -
 75
75 -
 76
76 -
 77
77 -
 78
78 -
 79
79 -
 80
80 -
 81
81
 |
 |

76
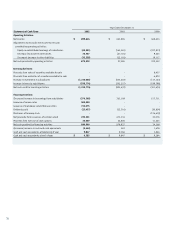
Year Ended December 31
Statements of Cash Flows 2002 2001 2000
Operating Activities:
Net income $ 899,644 $ 641,965 $ 469,634
Adjustments to reconcile net income to net cash
provided by operating activities:
Equity in undistributed earnings of subsidiaries (69,531) (545,061) (227,873)
Decrease (increase) in other assets 78,537 (47,701) 9,625
(Increase) decrease in other liabilities (33,328) (22,118) 19,117
Net cash provided by operating activities 875,322 27,085 270,503
Investing Activities:
Proceeds from sales of securities available for sale - - 8,455
Proceeds from maturities of securities available for sale - - 6,832
Increase in investment in subsidiaries (1,210,000) (653,202) (117,123)
Increase in loans to subsidiaries (559,774) (252,257) (199,798)
Net cash used for investing activities (1,769,774) (905,459) (301,634)
Financing Activities:
(Decrease) increase in borrowings from subsidiaries (376,598) 365,109 157,711
Issuance of senior notes 300,000 --
Issuance of mandatory convertible securities 725,075 --
Dividends paid (23,457) (22,310) (20,824)
Purchases of treasury stock - - (134,619)
Net proceeds from issuances of common stock 232,321 473,334 21,076
Proceeds from exercise of stock options 33,649 62,804 11,225
Net cash provided by financing activities 890,990 878,937 34,569
(Decrease) increase in cash and cash equivalents (3,462) 563 3,438
Cash and cash equivalents at beginning of year 9,847 9,284 5,846
Cash and cash equivalents at end of year $ 6,385 $ 9,847 $ 9,284