Capital One 2002 Annual Report Download - page 24
Download and view the complete annual report
Please find page 24 of the 2002 Capital One annual report below. You can navigate through the pages in the report by either clicking on the pages listed below, or by using the keyword search tool below to find specific information within the annual report.-
 1
1 -
2
-
3
-
4
-
5
-
6
-
7
-
8
-
9
-
10
-
11
-
12
-
13
-
 14
14 -
 15
15 -
 16
16 -
 17
17 -
 18
18 -
 19
19 -
 20
20 -
 21
21 -
 22
22 -
 23
23 -
 24
24 -
 25
25 -
 26
26 -
 27
27 -
 28
28 -
 29
29 -
 30
30 -
 31
31 -
 32
32 -
 33
33 -
 34
34 -
35
-
36
-
37
-
38
-
39
-
40
-
41
-
42
-
43
-
44
-
45
-
46
-
47
-
48
-
49
-
50
-
51
-
52
-
53
-
54
-
55
-
56
-
57
-
58
-
59
-
60
-
61
-
62
-
63
-
64
-
65
-
66
-
67
-
68
-
69
-
70
-
71
-
72
-
73
-
74
-
75
-
76
-
77
-
78
-
79
-
80
-
81
 |
 |

22
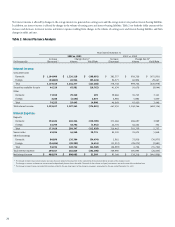
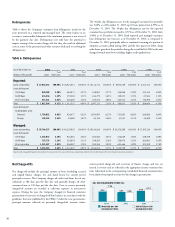
Marketing expenses increased $176.8 million, or 20%, to $1.1 billion,
reflecting the Company’s increase in marketing investment in existing and
new product opportunities. Salaries and associate benefits expense increased
$368.7 million, or 36%, to $1.4 billion as a direct result of the cost of
operations and expansion to manage the growth in the Company’s accounts
and products offered. In 2001, average accounts grew 39% over 2000 as a
result of the continued success of the Company’s marketing and account
management strategies.
CONSOLIDATED STATEMENTS OF INCOME
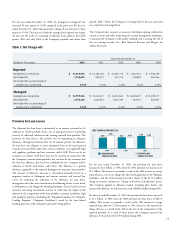
Net Interest Income
Net interest income is interest and past-due fees earned from the Company’s
consumer loans and securities less interest expense on borrowings, which
includes interest-bearing deposits, borrowings from senior notes and other
borrowings.
Reported net interest income for the year ended December 31, 2002, was
$2.7 billion compared to $1.8 billion for 2001, representing an increase of
$968.9 million, or 55%. Net interest income increased primarily as a result
of growth in the Company’s earning assets. Average earning assets increased
50% for the year ended December 31, 2002, to $31.1 billion from $20.7
billion for the year ended December 31, 2001. The reported net interest
margin increased to 8.73% in 2002, from 8.45% in 2002. The increase is
primarily due to a 93 basis point decrease in the cost of funds, offset by a 64
basis point decrease in the yield on consumer loans to 15.15% for the year
ended December 31, 2002, from 15.79% for the year ended December 31,
2001. The yield on consumer loans decreased primarily due to a shift in the
mix of the reported portfolio toward a greater composition of lower yielding,
higher credit quality loans as compared to the prior year. $38.4 million of the
increase in net interest income, representing a 12 basis point increase in the
net interest margin in 2002, relates to the one-time impact of the change in
recoveries estimate (see “Change in Recoveries Classification” above).
Reported net interest income for the year ended December 31, 2001, was
$1.8 billion compared to $1.7 billion for 2000, representing an increase of
$97.2 million, or 6%. Net interest income increased as a result of the growth
in earning assets. Average earning assets increased 56% for the year ended
December 31, 2001, to $20.7 billion from $13.3 billion for the year ended
December 31, 2000. The reported net interest margin decreased to 8.45% in
2001, from 12.47% in 2000, and was primarily attributable to a 467 basis
point decrease in the yield on consumer loans to 15.79% for the year ended
December 31, 2001, from 20.46% for the year ended December 31, 2000.
The yield on consumer loans decreased primarily due to a shift in the mix of
the reported portfolio toward a greater composition of lower yielding, higher
credit quality loans, a decrease in the frequency of past-due fees and a selective
increase in the use of low introductory rates as compared to the prior year.
During 2002, the fair value of the Company’s interest-only strips decreased
$33.1 million, including both the impact of gains from securitization
transactions and changes to key fair value assumptions. Comparatively, the
fair value of the Company’s interest-only strips increased $150.0 million in
2001, including both the impact of gains associated with securitization
transactions and changes to key fair value assumptions. The 2002 decrease in
the fair value of the interest-only strips primarily relates to the addition of
introductory rate loans to the trusts, the reduced interest rate environment,
and increasing charge-off rates. (See Note R to the Consolidated Financial
Statements)
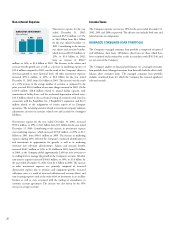
During 2002, marketing expenses increased a modest 13% over 2001,
reflecting a shift in strategy to reduce loan growth during the second half of
the year. During 2002, operating expenses increased 18%, compared with
managed loan growth of 32%, reflecting lower account growth and increased
operating efficiencies, offset by $110.0 million of one-time charges.
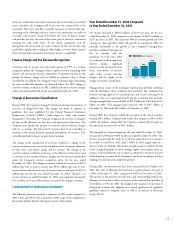
Year Ended December 31, 2001 Compared
to Year Ended December 31, 2000
Net income of $642.0 million, or $2.91 per share, for the year ended
December 31, 2001, compared to net income of $469.6 million, or $2.24 per
share, in 2000. This represents 37% net income growth and 30% earnings per
share growth in 2001. The growth in earnings for 2001 was primarily
attributable to the growth in the Company’s managed loan portfolio, offset by a
reduction in the managed net interest margin, increases in the provision for
loan losses, and higher non-interest expenses.
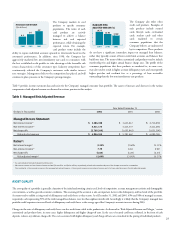
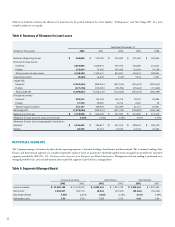
Average managed loans increased 58% to $35.6 billion for 2001 from $22.6
billion for 2000. Total managed loans increased 54% to $45.3 billion at
December 31, 2001 from $29.5 billion at December 31, 2000.
The managed net interest margin for the year ended December 31, 2001,
decreased to 9.40% from 11.11% for the year ended December 31, 2000.
This decrease was primarily the result of a 237 basis point decrease in
consumer loan yield to 15.88% for 2001, from 18.25% in 2000. The decrease
in consumer loan yield was due to a shift in the mix of the managed portfolio
to lower yielding, higher credit quality loans, as well as an increase in the
amount of low introductory rate balances as compared to the prior year.
During 2001, the provision for loan losses increased by $307.6 million or
38% over 2000. The ratio of allowance for loan losses to reported loans
increased to 4.02% at December 31, 2001 compared to 3.49% at December
31, 2000. The increase in the provision for loan losses and corresponding
build in the allowance for loan losses reflects the growth in the reported loan
portfolio of $5.8 billion or 38% over 2000, offset by a reduction in the
reported net charge-off rate to 4.76% for 2001 compared to 5.46% in 2000.