Capital One 2002 Annual Report Download - page 43
Download and view the complete annual report
Please find page 43 of the 2002 Capital One annual report below. You can navigate through the pages in the report by either clicking on the pages listed below, or by using the keyword search tool below to find specific information within the annual report.-
 1
1 -
2
-
3
-
4
-
5
-
6
-
7
-
8
-
9
-
10
-
11
-
12
-
13
-
14
-
15
-
16
-
17
-
18
-
19
-
20
-
21
-
22
-
23
-
24
-
25
-
26
-
27
-
28
-
29
-
30
-
31
-
32
-
 33
33 -
 34
34 -
 35
35 -
 36
36 -
 37
37 -
 38
38 -
 39
39 -
 40
40 -
 41
41 -
 42
42 -
 43
43 -
 44
44 -
 45
45 -
 46
46 -
 47
47 -
 48
48 -
 49
49 -
 50
50 -
 51
51 -
 52
52 -
 53
53 -
54
-
55
-
56
-
57
-
58
-
59
-
60
-
61
-
62
-
63
-
64
-
65
-
66
-
67
-
68
-
69
-
70
-
71
-
72
-
73
-
74
-
75
-
76
-
77
-
78
-
79
-
80
-
81
 |
 |

41
Revenue
Revenues are expected to grow approximately 14-16% in 2003. Net interest
margin is expected to fluctuate somewhat due to the scheduled repricings of
certain introductory rate credit card products and a gradual shift towards
superprime assets, but is expected to stabilize at approximately 9-10% in
2003. Non-interest income is expected to remain stable in 2003 compared to
2002, consistent with a gradual shift towards higher credit quality assets,
which generate less fee income than assets generated by customers at the
lower end of the credit spectrum. Risk adjusted margin should also fluctuate
as a result of underlying revenue and charge-off dynamics, but is expected to
stabilize at approximately 10% in 2003.
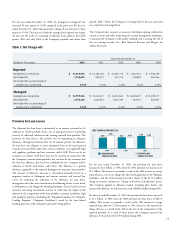
Marketing Investment
As stated previously, marketing expense is expected to be on average
approximately $300.0 million per quarter in 2003. A portion of this
marketing spending will continue to support our efforts to build a strong
brand for the Company. Our “What’s in Your Wallet?” campaign has resulted
in the Company achieving brand awareness and brand equity scores among
the highest in the credit card industry, as measured by third-party firms. The
Company believes the branded franchise that it is building strengthens and
enables its IBS and mass customization strategies across product lines. The
Company cautions however, that an increase or decrease in marketing
expense or brand awareness does not necessarily correlate to a comparable
increase or decrease in outstandings balances or accounts due to, among
other factors, the long-term nature of brand building, consumer attrition and
utilization patterns, and shifts over time in targeting customers and/or
products that have varying marketing acquisition costs.
Management expects to vary its marketing across its credit card, installment
lending and auto lending products depending on the competitive dynamics
of the various markets in which it participates. Currently, among the
Company’s various product lines, U.S. credit cards marketed to consumers
with the most favorable credit profiles are facing the highest degree of
intensity of competition. Accordingly, the Company expects to focus a larger
proportion of its marketing expenditures on other products marketed to
similar consumer bases, such as installment loans and U.K. credit cards, in
the short term. The Company expects to adjust its marketing allocations,
however, to target specific product lines that it believes offer the highest
response rates and opportunities from time to time.
As a result of overall marketing spending increasing over levels realized in the
second half of 2002, the Company expects account growth to resume in
2003, and to result in annual growth of approximately 5-10%. The
Company also expects managed loans outstanding to increase by
approximately 20-25% in 2003, comprising approximately 25% growth in
prime and superprime assets, and approximately 10-15% growth in
subprime assets.
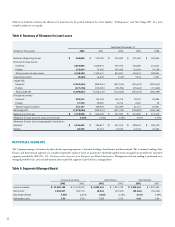
BUSINESS OUTLOOK
This business outlook section summarizes the Company’s expectations for
earnings for 2003, and its primary goals and strategies for continued growth.
The statements contained in this section are based on management’s current
expectations. Certain statements are forward looking, and therefore actual
results could differ materially. Factors that could materially influence results
are set forth throughout this section and in the Company’s Annual Report on
Form 10-K for the year ended December 31, 2002 (Part I, Item 1, Risk
Factors).
Earnings Goals
The Company has historically targeted an annual growth in earnings per
share of at least 20%, with 2002 marking the eighth consecutive year that
this goal has been achieved. Looking forward, the Company anticipates
earnings per share results of approximately $4.55 in 2003, which is
approximately 16% growth over the $3.93 earnings per share achieved in
2002. The Company continues to target long-term earnings per share growth
of 20%.
The Company’s 2003 earnings per share growth target results from our
decision in mid-2002 to moderate the growth of our managed loans
outstanding to 20-25% in 2003 from 32%, 53% and 46% in 2002, 2001
and 2000, respectively. To slow the growth of the Company’s managed loans
outstandings, it reduced marketing spending from $674.0 million in the first
half of 2002 to $396.6 million in the second half of 2002. This reduction in
spending led to an increase in earnings per share growth in 2002 to 35%
from the 20% growth originally forecasted. In 2003, the Company expects
marketing spending to increase to approximately $300.0 million per quarter.
The Company expects to achieve these results based on the continued success
of its business strategies and its current assessment of the competitive,
regulatory and funding market environments that it faces (each of which is
discussed elsewhere in this Annual Report), as well as the expectation that the
geographies in which the Company competes will not experience significant
consumer credit quality erosion, as might be the case in an economic
downturn or recession.
The Company’s earnings are a function of our revenues (net interest income
and non-interest income), consumer usage, payment and attrition patterns,
credit quality of our earning assets (which affects fees and chargeoffs) and the
Company’s marketing and operating expenses. An overview of trends in these
metrics, as well as a discussion of our core IBS and the competitive dynamics
of the Company’s three operating segments follow.