Capital One 2002 Annual Report Download - page 58
Download and view the complete annual report
Please find page 58 of the 2002 Capital One annual report below. You can navigate through the pages in the report by either clicking on the pages listed below, or by using the keyword search tool below to find specific information within the annual report.-
 1
1 -
2
-
3
-
4
-
5
-
6
-
7
-
8
-
9
-
10
-
11
-
12
-
13
-
14
-
15
-
16
-
17
-
18
-
19
-
20
-
21
-
22
-
23
-
24
-
25
-
26
-
27
-
28
-
29
-
30
-
31
-
32
-
33
-
34
-
35
-
36
-
37
-
38
-
39
-
40
-
41
-
42
-
43
-
44
-
45
-
46
-
47
-
 48
48 -
 49
49 -
 50
50 -
 51
51 -
 52
52 -
 53
53 -
 54
54 -
 55
55 -
 56
56 -
 57
57 -
 58
58 -
 59
59 -
 60
60 -
 61
61 -
 62
62 -
 63
63 -
 64
64 -
 65
65 -
 66
66 -
 67
67 -
 68
68 -
69
-
70
-
71
-
72
-
73
-
74
-
75
-
76
-
77
-
78
-
79
-
80
-
81
 |
 |

56
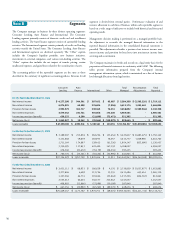
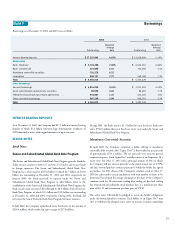
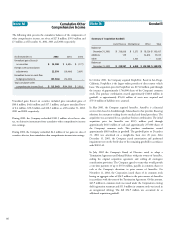
Note B Segments
The Company manages its business by three distinct operating segments:
Consumer Lending, Auto Finance and International. The Consumer
Lending segment primarily consists of domestic credit card and installment
lending activities. The Auto Finance segment consists of automobile lending
activities. The International segment consists primarily of credit card lending
activities outside the United States. The Consumer Lending, Auto Finance
and International segments are disclosed separately. The “Other” caption
includes the Company’s liquidity portfolio, new business initiatives,
investments in external companies, and various non-lending activities. The
“Other” caption also includes the net impact of transfer pricing, certain
unallocated expenses, and gains/losses related to the securitization of assets.
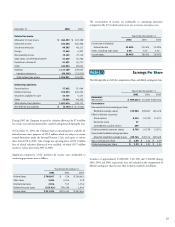
The accounting policies of the reportable segments are the same as those
described in the summary of significant accounting policies. Revenue for all
segments is derived from external parties. Performance evaluation of and
resource allocation to each line of business within each reportable segment is
based on a wide range of indicators to include both historical and forecasted
operating results.
Management decision making is performed on a managed portfolio basis.
An adjustment to reconcile the managed financial information to the
reported financial information in the consolidated financial statements is
provided. This adjustment reclassifies a portion of net interest income, non-
interest income and provision for loan losses into non-interest income from
servicing and securitization.
The Company maintains its books and records on a legal entity basis for the
preparation of financial statements in conformity with GAAP. The following
tables present information prepared from the Company’s internal
management information system, which is maintained on a line of business
level through allocations from legal entities.
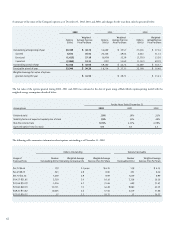
Consumer Auto Total Securitization Total
Lending Finance International Other Managed Adjustments Reported
For the Year Ended December 31, 2002
Net interest income $ 4,277,298 $ 544,501 $ 397,452 $ 65,087 $ 5,284,338 $ (2,565,226) $ 2,719,112
Non-interest income 4,076,925 65,509 276,696 (7,956) 4,411,174 1,055,662 5,466,836
Provision for loan losses 2,992,579 361,717 230,345 74,251 3,658,892 (1,509,564) 2,149,328
Non-interest expenses 3,679,342 231,741 501,068 173,430 4,585,581 - 4,585,581
Income tax provision (benefit) 639,275 6,290 (21,699) (72,471) 551,395 - 551,395
Net income (loss) $ 1,043,027 $ 10,262 $ (35,566) $ (118,079) $ 899,644 $ - $ 899,644
Loans receivable $ 47,290,100 $ 6,992,541 $ 5,330,541 $ 133,355 $ 59,746,537 $ (31,892,885) $ 27,853,652
For the Year Ended December 31, 2001
Net interest income $ 3,189,207 $ 215,838 $ 282,226 $ (53,454) $ 3,633,817 $ (1,883,675) $ 1,750,142
Non-interest income 3,131,868 19,879 183,973 78,057 3,413,777 1,049,985 4,463,762
Provision for loan losses 1,711,164 174,897 129,412 (61,326) 1,954,147 (833,690) 1,120,457
Non-interest expenses 3,350,595 117,853 422,420 167,159 4,058,027 - 4,058,027
Income tax provision (benefit) 478,540 (21,672) (35,179) (28,234) 393,455 - 393,455
Net income (loss) $ 780,776 $ (35,361) $ (50,454) $ (52,996) $ 641,965 $ - $ 641,965
Loans receivable $37,324,079 $ 3,957,729 $ 3,970,244 $ 11,911 $ 45,263,963 $(24,342,949) $20,921,014
For the Year Ended December 31, 2000
Net interest income $ 2,431,111 $ 88,933 $ 186,639 $ 4,176 $ 2,710,859 $ (1,057,977) $ 1,652,882
Non-interest income 2,277,806 6,609 113,726 13,355 2,411,496 653,614 3,065,110
Provision for loan losses 1,107,246 64,774 101,046 (55,842) 1,217,224 (404,363) 812,861
Non-interest expenses 2,525,612 64,626 344,577 212,842 3,147,657 - 3,147,657
Income tax provision (benefit) 408,903 (12,866) (57,998) (50,199) 287,840 - 287,840
Net income (loss) $ 667,156 $ (20,992) $ (87,260) $ (89,270) $ 469,634 $ - $ 469,634
Loans receivable $25,449,167 $ 1,173,782 $ 2,970,751 $ (69,674) $ 29,524,026 $(14,411,314) $15,112,712