Capital One 2002 Annual Report Download - page 32
Download and view the complete annual report
Please find page 32 of the 2002 Capital One annual report below. You can navigate through the pages in the report by either clicking on the pages listed below, or by using the keyword search tool below to find specific information within the annual report.-
 1
1 -
2
-
3
-
4
-
5
-
6
-
7
-
8
-
9
-
10
-
11
-
12
-
13
-
14
-
15
-
16
-
17
-
18
-
19
-
20
-
21
-
 22
22 -
 23
23 -
 24
24 -
 25
25 -
 26
26 -
 27
27 -
 28
28 -
 29
29 -
 30
30 -
 31
31 -
 32
32 -
 33
33 -
 34
34 -
 35
35 -
 36
36 -
 37
37 -
 38
38 -
 39
39 -
 40
40 -
 41
41 -
 42
42 -
43
-
44
-
45
-
46
-
47
-
48
-
49
-
50
-
51
-
52
-
53
-
54
-
55
-
56
-
57
-
58
-
59
-
60
-
61
-
62
-
63
-
64
-
65
-
66
-
67
-
68
-
69
-
70
-
71
-
72
-
73
-
74
-
75
-
76
-
77
-
78
-
79
-
80
-
81
 |
 |

30
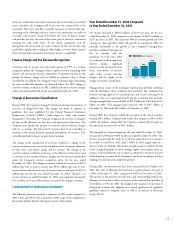
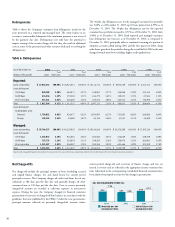
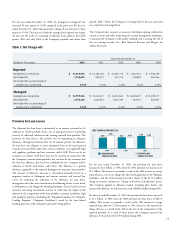
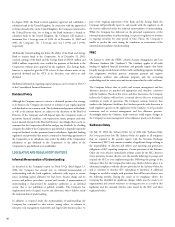
The 30-plus day delinquency rate for the managed consumer loan portfolio
was 5.60% as of December 31, 2002, up 65 basis points from 4.95% as of
December 31, 2001. The 30-plus day delinquency rate for the reported
consumer loan portfolio increased to 6.51% as of December 31, 2002, from
4.84% as of December 31, 2001. Both reported and managed consumer
loan delinquency rate increases as of December 31, 2002, as compared to
December 31, 2001, principally reflect a continued seasoning of a portion of
subprime accounts added during 2001 and the first quarter of 2002, along
with slower growth of the portfolio during the second half of 2002 as the mix
changed towards more lower yielding, higher credit quality loans.
Delinquencies
Table 6 shows the Company’s consumer loan delinquency trends for the
years presented on a reported and managed basis. The entire balance of an
account is contractually delinquent if the minimum payment is not received
by the payment due date. Delinquencies not only have the potential to
impact earnings if the account charges off, but they also result in additional
costs in terms of the personnel and other resources dedicated to resolving the
delinquencies.
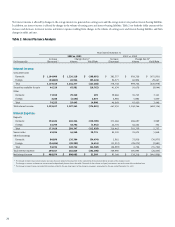
Table 6: Delinquencies
As of December 31 2002 2001 2000 1999 1998
% of % of % of % of % of
(Dollars in Thousands) Loans Total Loans Loans Total Loans Loans Total Loans Loans Total Loans Loans Total Loans
Reported:
Loans outstanding $ 27,853,652 100.00% $ 20,921,014 100.00% $ 15,112,712 100.00% $ 9,913,549 100.00% $ 6,157,111 100.00%
Loans delinquent:
30-59 days 830,389 2.98% 494,871 2.37% 418,967 2.77% 236,868 2.39% 123,162 2.00%
60-89 days 414,544 1.49% 233,206 1.11% 242,770 1.61% 129,251 1.30% 67,504 1.10%
90 or more days 567,431 2.04% 284,480 1.36% 435,574 2.88% 220,513 2.23% 98,798 1.60%
Total $ 1,812,364 6.51% $ 1,012,557 4.84% $ 1,097,311 7.26% $ 586,632 5.92% $ 289,464 4.70%
Loans delinquent
by geographic area:
Domestic 1,709,822 6.83% 930,077 5.02% 1,034,995 8.23% 533,081 6.85% 264,966 5.80%
Foreign 102,542 3.63% 82,480 3.47% 62,316 2.46% 53,551 2.51% 24,498 1.54%
Managed:
Loans outstanding $ 59,746,537 100.00% $ 45,263,963 100.00% $ 29,524,026 100.00% $ 20,236,588 100.00% $ 17,395,126 100.00%
Loans delinquent:
30-59 days 1,366,072 2.29% 934,681 2.06% 605,040 2.05% 416,829 2.06% 329,239 1.89%
60-89 days 753,735 1.26% 502,959 1.11% 349,250 1.18% 238,476 1.18% 182,982 1.05%
90 or more days 1,225,587 2.05% 804,007 1.78% 590,364 2.00% 403,464 1.99% 305,589 1.76%
Total $ 3,345,394 5.60% $ 2,241,647 4.95% $ 1,544,654 5.23% $ 1,058,769 5.23% $ 817,810 4.70%
Reported and managed delinquency rates include 28 basis point and 13 basis point increases, respectively, related to the one-time impact of the 2002 change in recoveries assumption.
current period charge-offs and recoveries of finance charges and fees are
treated as revenue and are reflected in the appropriate income statement line
item. All periods in the accompanying consolidated financial statements have
been adjusted to properly account for this change in presentation.
Net Charge-Offs
Net charge-offs include the principal amount of losses (excluding accrued
and unpaid finance charges, fees and fraud losses) less current period
principal recoveries. The Company charges off credit card loans (net of any
collateral) at 180 days past the due date and generally charges off other
consumer loans at 120 days past the due date. Costs to recover previously
charged-off accounts are recorded as collection expenses in non-interest
expense. During the year, the Company changed its financial statement
presentation of recoveries of charged-off loan balances in accordance with the
guidelines that were published by the FFIEC. Under the new presentation,
principal amounts collected on previously charged-off accounts reduce
MANAGED 30+ DAY
DELINQUENCY RATE
2001
5.60
2002
6.51
4.95 4.84
2000
5.23
7.26
REPORTED 30+ DAY
DELINQUENCY RATE
30+ DAY DELINQUENCY RATE (%)