Capital One 2002 Annual Report Download - page 30
Download and view the complete annual report
Please find page 30 of the 2002 Capital One annual report below. You can navigate through the pages in the report by either clicking on the pages listed below, or by using the keyword search tool below to find specific information within the annual report.-
 1
1 -
2
-
3
-
4
-
5
-
6
-
7
-
8
-
9
-
10
-
11
-
12
-
13
-
14
-
15
-
16
-
17
-
18
-
19
-
 20
20 -
 21
21 -
 22
22 -
 23
23 -
 24
24 -
 25
25 -
 26
26 -
 27
27 -
 28
28 -
 29
29 -
 30
30 -
 31
31 -
 32
32 -
 33
33 -
 34
34 -
 35
35 -
 36
36 -
 37
37 -
 38
38 -
 39
39 -
 40
40 -
41
-
42
-
43
-
44
-
45
-
46
-
47
-
48
-
49
-
50
-
51
-
52
-
53
-
54
-
55
-
56
-
57
-
58
-
59
-
60
-
61
-
62
-
63
-
64
-
65
-
66
-
67
-
68
-
69
-
70
-
71
-
72
-
73
-
74
-
75
-
76
-
77
-
78
-
79
-
80
-
81
 |
 |
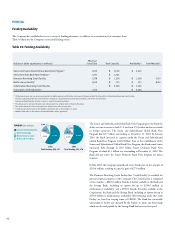
Collections received from securitized receivables are used to pay interest to
investors, servicing and other fees, and are available to absorb the investors’
share of credit losses. For revolving securitizations, amounts collected in excess
of that needed to pay the above amounts are remitted to the Company, as
described previously in “Servicing and Securitizations Income.” For amortizing
securitizations, amounts in excess of the amount that is used to pay interest, fees
and principal are generally remitted to the Company, but may be paid to
investors in further reduction of their outstanding principal as described below.
Investors in the Company’s revolving securitization program are generally
entitled to receive principal payments either in one lump sum after an
accumulation period or through monthly payments during an amortization
period. Amortization may begin sooner in certain circumstances, including
the possibility of the annualized portfolio yield (generally consisting of
interest and fees) for a three-month period dropping below the sum of the
security rate payable to investors, loan servicing fees and net credit losses
during the period. Increases in net credit losses and payment rates could
significantly decrease the spread and cause early amortization. This early
amortization would have a significant effect on the ability of the Bank and
the Savings Bank to meet the capital adequacy requirements as all off-balance
sheet loans experiencing such early amortization would have to be recorded
on the balance sheet. At December 31, 2002, the annualized portfolio yields
on the Company’s off-balance sheet securitizations sufficiently exceeded the
sum of the related security rates payable to investors, loan servicing fees and
net credit losses, and as such, early amortizations of its off-balance sheet
securitizations was not indicated or expected.
In revolving securitizations, prior to the commencement of the amortization or
accumulation period, the investors’ shares of the principal payments received on
the trusts’ receivables are reinvested in new receivables to maintain the principal
balance of the securities. During the amortization period, the investors’ share of
principal payments is paid to the security holders until the securities are repaid.
When the trust allocates principal payments to the security holders, the
Company’s reported consumer loans increase by the amount of any new
activity on the accounts. During the accumulation period, the investors’ share
of principal payments is paid into a principal funding account designed to
accumulate principal collections so the securities can be paid in full on the
expected final payment date.
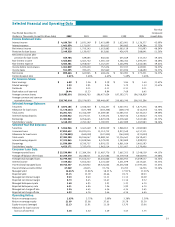
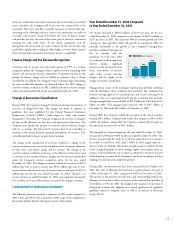
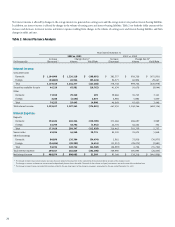
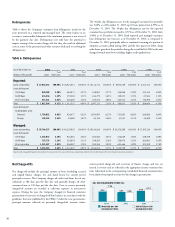
Table 4 indicates the impact of the consumer loan securitizations on average
earning assets, net interest margin and loan yield for the periods presented. The
Company intends to continue to securitize consumer loans.
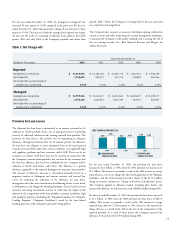
Table 4: Comparison of Managed and Reported
Operating Data and Ratios
Year Ended December 31
(Dollars in Thousands) 2002 2001 2000
Reported:
Average earning assets
$ 31,147,599 $ 20,706,172 $ 13,252,033
Net interest margin(1) 8.73% 8.45% 12.47%
Loan yield(2) 15.15 15.79 20.46
Managed:
Average earning assets
$ 57,266,637 $ 38,650,677 $ 24,399,119
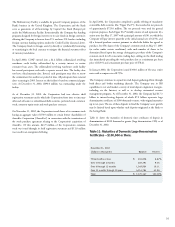
Net interest margin(1) 9.23% 9.40% 11.11%
Loan yield(2) 14.64 15.88 18.25
(1) Reported and managed net interest margin increased 12 basis points and 7 basis points,
respectively as a result of the one-time impact of the change in recoveries assumption for the
year ended December 31, 2002.
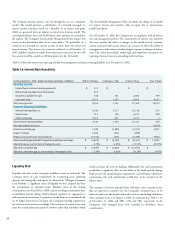
(2) Reported and managed loan yield increased 15 basis points and 7 basis points, respectively as
a result of the one-time impact of the change in recoveries assumption for the year ended
December 31, 2002.
Risk Adjusted Revenue Margin
The Company’s products are designed with the objective of maximizing
customer value while optimizing revenue for the level of risk undertaken.
Management believes that comparable measures for external analysis are the
risk adjusted revenue and risk adjusted margin of the managed portfolio. Risk
adjusted revenue is defined as net interest income and non-interest income less net
charge-offs. Risk adjusted margin measures risk adjusted revenue as a percentage of
average earning assets. These measures consider not only the loan yield and net
interest margin, but also the fee income associated with these products. By
deducting net charge-offs, consideration is given to the risk inherent in the
Company’s portfolio.
28
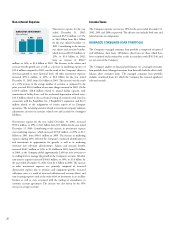
2001
9.23
2002
8.73
9.40 8.45
2000
11.11
12.47
MANAGED NET
INTEREST MARGIN
NET INTEREST MARGIN (%)
REPORTED NET
INTEREST MARGIN
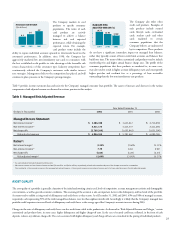
MANAGED LOAN YIELD
2001
14.64
2002
15.15
15.88 15.79
2000
18.25 20.46
REPORTED LOAN YIELD
LOAN YIELD (%)