Capital One 2002 Annual Report Download - page 67
Download and view the complete annual report
Please find page 67 of the 2002 Capital One annual report below. You can navigate through the pages in the report by either clicking on the pages listed below, or by using the keyword search tool below to find specific information within the annual report.-
 1
1 -
2
-
3
-
4
-
5
-
6
-
7
-
8
-
9
-
10
-
11
-
12
-
13
-
14
-
15
-
16
-
17
-
18
-
19
-
20
-
21
-
22
-
23
-
24
-
25
-
26
-
27
-
28
-
29
-
30
-
31
-
32
-
33
-
34
-
35
-
36
-
37
-
38
-
39
-
40
-
41
-
42
-
43
-
44
-
45
-
46
-
47
-
48
-
49
-
50
-
51
-
52
-
53
-
54
-
55
-
56
-
 57
57 -
 58
58 -
 59
59 -
 60
60 -
 61
61 -
 62
62 -
 63
63 -
 64
64 -
 65
65 -
 66
66 -
 67
67 -
 68
68 -
 69
69 -
 70
70 -
 71
71 -
 72
72 -
 73
73 -
 74
74 -
 75
75 -
 76
76 -
 77
77 -
78
-
79
-
80
-
81
 |
 |

65
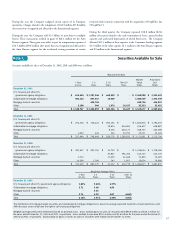
December 31 2002 2001
Deferred tax assets:
Allowance for loan losses $ 442,393 $ 107,389
Unearned income 323,404 260,208
Stock incentive plan 49,585 48,117
Foreign 17,469 4,203
Net operating losses 19,165 23,119
State taxes, net of federal benefit 61,649 50,786
Derivative instruments 61,491 45,371
Other 142,033 89,831
Subtotal 1,117,189 629,024
Valuation allowance (60,368) (52,933)
Total deferred tax assets 1,056,821 576,091
Deferred tax liabilities:
Securitizations 57,962 75, 084
Deferred revenue 915,953 624,254
Securities available for sale 33,735 5,453
Other 53,964 44,322
Total deferred tax liabilities 1,061,614 749,113
Net deferred tax liabilities $ (4,793) $ (173,022)
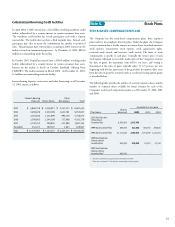
During 2002, the Company increased its valuation allowance by $7.4 million
for certain state and international loss carryforwards generated during the year.
At December 31, 2002, the Company had net operating losses available for
federal income taxes purposes of $55.0 million which are subject to certain
annual limitations under the Internal Revenue Code, and expire at various
dates from 2018 to 2020. Also, foreign net operating losses of $56.7 million
(net of related valuation allowances) were available, of which $55.7 million
expires at various dates from 2005 to 2008.
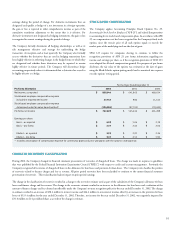
Significant components of the provision for income taxes attributable to
continuing operations were as follows:
Year Ended December 31
2002 2001 2000
Federal taxes $ 708,667 $ 138 $ 284,661
State taxes 5,485 2,214 578
International taxes 2,654 555 1,156
Deferred income taxes (165,411) 390,548 1,445
Income taxes $ 551,395 $393,455 $ 287,840
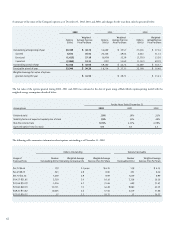
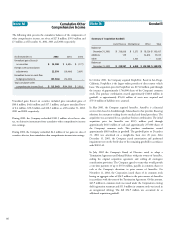
The reconciliation of income tax attributable to continuing operations
computed at the U.S. federal statutory tax rate to income tax expense was:
Year Ended December 31
2002 2001 2000
Income tax at statutory
federal tax rate 35.00% 35.00% 35.00%
Other, including state taxes 3.00 3.00 3.00
Income taxes 38.00% 38.00% 38.00%
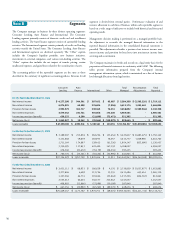
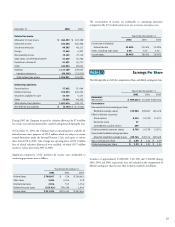
Note L Earnings Per Share
The following table sets forth the computation of basic and diluted earnings per share:
Year Ended December 31
2002 2001 2000
Numerator:
Net income $ 899,644 $ 641,965 $ 469,634
Denominator:
Denominator for basic earnings per share-
Weighted-average shares 219,984 209,867 196,478
Effect of dilutive securities:
Stock options 8,224 10,709 12,971
Restricted stock 37 --
Contingently issuable shares 499 --
Dilutive potential common shares 8,760 10,709 12,971
Denominator for diluted earnings per share-
Adjusted weighted-average shares 228,744 220,576 209,449
Basic earnings per share $ 4.09 $ 3.06 $ 2.39
Diluted earnings per share $ 3.93 $ 2.91 $ 2.24
Securities of approximately 23,000,000, 5,217,000 and 5,496,000 during
2002, 2001 and 2000, respectively, were not included in the computation of
diluted earnings per share because their inclusion would be antidilutive.