Capital One 2002 Annual Report Download - page 76
Download and view the complete annual report
Please find page 76 of the 2002 Capital One annual report below. You can navigate through the pages in the report by either clicking on the pages listed below, or by using the keyword search tool below to find specific information within the annual report.-
 1
1 -
2
-
3
-
4
-
5
-
6
-
7
-
8
-
9
-
10
-
11
-
12
-
13
-
14
-
15
-
16
-
17
-
18
-
19
-
20
-
21
-
22
-
23
-
24
-
25
-
26
-
27
-
28
-
29
-
30
-
31
-
32
-
33
-
34
-
35
-
36
-
37
-
38
-
39
-
40
-
41
-
42
-
43
-
44
-
45
-
46
-
47
-
48
-
49
-
50
-
51
-
52
-
53
-
54
-
55
-
56
-
57
-
58
-
59
-
60
-
61
-
62
-
63
-
64
-
65
-
 66
66 -
 67
67 -
 68
68 -
 69
69 -
 70
70 -
 71
71 -
 72
72 -
 73
73 -
 74
74 -
 75
75 -
 76
76 -
 77
77 -
 78
78 -
 79
79 -
 80
80 -
 81
81
 |
 |

74
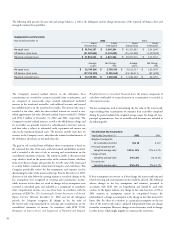
Note V International Activities
The Company’s international activities are primarily performed through Capital One Bank (Europe) plc, a subsidiary bank of the Bank that provides consumer
lending and other financial products in Europe and Capital One Bank - Canada Branch, a foreign branch office of the Bank that provides consumer lending
products in Canada. The total assets, revenue, income before income taxes and net income of the international operations are summarized below.
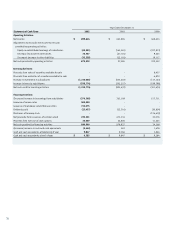
2002 2001 2000
Domestic
Total assets $ 34,420,099 $ 25,254,438 $ 15,719,760
Revenue(1) 7,604,075 5,738,433 4,430,700
Income before income taxes 1,436,706 1,064,420 906,732
Net income 899,429 660,809 562,174
International
Total assets 2,962,281 2,929,609 3,169,581
Revenue(1) 581,873 475,471 287,292
Income before income taxes 14,333 (29,000) (149,258)
Net income (loss) 215 (18,844) (92,540)
Total Company
Total assets $ 37,382,380 $ 28,184,047 $ 18,889,341
Revenue(1) 8,185,948 6,213,904 4,717,992
Income before income taxes 1,451,039 1,035,420 757,474
Net income 899,644 641,965 469,634
(1) Revenue equals net interest income plus non-interest income.
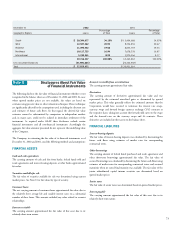
Derivatives
The carrying amount of derivatives approximated fair value and was represented by the estimated unrealized losses as determined by quoted market prices.
This value generally reflects the estimated amounts that the Corporation would have paid to terminate the interest rate swaps, currency swaps and f/x contracts
at the respective dates, taking into account the forward yield curve on the swaps and the forward rates on the currency swaps and f/x contracts. These
derivatives are included in other liabilities on the balance sheet.
2002 2001
Carrying Estimated Carrying Estimated
Amount Fair Value Amount Fair Value
Financial Assets
Cash and cash equivalents $ 918,778 $ 918,778 $ 707,238 $ 707,238
Securities available for sale 4,423,677 4,423,677 3,115,891 3,115,891
Net loans 26,133,652 26,133,652 20,081,014 20,081,014
Interest receivable 217,512 217,512 105,459 105,459
Accounts receivable from securitizations 3,096,827 3,096,827 2,452,548 2,452,548
Derivatives 435,383 435,383 91,474 91,474
Financial Liabilities
Interest-bearing deposits $ 17,325,965 $ 18,260,362 $ 12,838,968 $ 13,223,954
Senior notes 5,565,615 5,432,411 5,335,229 5,237,220
Other borrowings 6,365,075 6,446,669 3,995,528 4,047,865
Interest payable 236,081 236,081 188,160 188,160
Derivatives 500,471 500,471 199,976 199,976