Capital One 2002 Annual Report Download - page 23
Download and view the complete annual report
Please find page 23 of the 2002 Capital One annual report below. You can navigate through the pages in the report by either clicking on the pages listed below, or by using the keyword search tool below to find specific information within the annual report.-
 1
1 -
2
-
3
-
4
-
5
-
6
-
7
-
8
-
9
-
10
-
11
-
12
-
 13
13 -
 14
14 -
 15
15 -
 16
16 -
 17
17 -
 18
18 -
 19
19 -
 20
20 -
 21
21 -
 22
22 -
 23
23 -
 24
24 -
 25
25 -
 26
26 -
 27
27 -
 28
28 -
 29
29 -
 30
30 -
 31
31 -
 32
32 -
 33
33 -
34
-
35
-
36
-
37
-
38
-
39
-
40
-
41
-
42
-
43
-
44
-
45
-
46
-
47
-
48
-
49
-
50
-
51
-
52
-
53
-
54
-
55
-
56
-
57
-
58
-
59
-
60
-
61
-
62
-
63
-
64
-
65
-
66
-
67
-
68
-
69
-
70
-
71
-
72
-
73
-
74
-
75
-
76
-
77
-
78
-
79
-
80
-
81
 |
 |

21
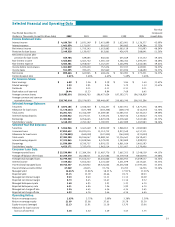
Year Ended December 31, 2002 Compared
to Year Ended December 31, 2001
Net income increased to $899.6 million, or $3.93 per share, for the year
ended December 31, 2002, compared to net income of $642.0 million, or
$2.91 per share, in 2001. This represents 40% net income growth and 35%
earnings per share growth in 2002. The growth in earnings for 2002 was
primarily attributable to the growth in the Company’s managed loan
portfolio, combined with gains on
sale of securities and the
repurchase of senior notes, offset
by a reduction in the managed net
interest margin, significant
increases in the provision for loan
losses, write-downs of interest-
only strips, certain one-time
charges, and the impact of the
change in recoveries classification.
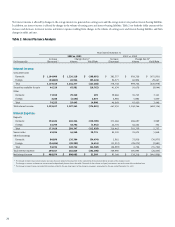
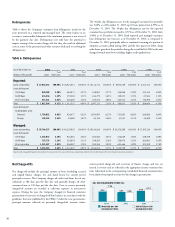
Managed loans consist of the Company’s reported loan portfolio combined
with the off-balance sheet securitized loan portfolio. The Company has
retained servicing rights for its securitized loans and receives servicing fees in
addition to the excess spread generated from the securitized loan portfolio.
Average managed loans increased 48% to $52.8 billion for 2002 from $35.6
billion for 2001. Total managed loans increased 32% to $59.7 billion at
December 31, 2002 from $45.3 billion at December 31, 2001.
During 2002, the Company realized after-tax gains on the sale of securities
totaling $48.1 million, compared with similar after tax gains in 2001 of $8.4
million. In addition, during 2002 the Company realized after-tax gains on
the repurchase of senior notes of $16.7 million.
The managed net interest margin for the year ended December 31, 2002,
decreased to 9.23% from 9.40% for the year ended December 31, 2001. This
decrease was primarily the result of a 124 basis point decrease in consumer
loan yield to 14.64% for 2002, from 15.88% in 2001, largely offset by a
decrease in the cost of funds. This decline in yield was due to a shift in the mix
of the managed portfolio to lower yielding, higher credit quality loans, an
increase in low introductory rate accounts as compared to the prior year and
reduced pricing on many of the Company’s new loans in response to lower
funding costs and increased competitive pressure.
During 2002, the provision for loan losses increased by $1.0 billion over
2001. The ratio of allowance for loan losses to reported loans increased to
6.18% at December 31, 2002, compared to 4.02% at December 31, 2001.
The increase in the provision for loan losses and corresponding build in the
allowance for loan losses reflects an increase in the reported loan portfolio of
$7.0 billion or 33% over 2001, the change in the treatment of recoveries of
charged-off accounts, the adoption of a revised application of regulatory
guidelines related to subprime loans, as well as an increase in forecasted
charge-off rates.
Gains on securitization transactions represent the present value of estimated
excess cash flows the Company will receive over the estimated life of the
receivables. This excess cash flow essentially represents an interest-only strip,
consisting of the following estimates: interest rate movements on yields of
receivables and securities issued to determine the excess of finance charges
and past-due fees over the sum of the return paid to investors, contractual
servicing fees and credit losses. To the extent assumptions used by
management do not prevail, fair value estimates of the interest-only strip
could differ significantly, resulting in either higher or lower future income
from servicing and securitization non-interest income, as applicable.
Finance Charge and Fee Revenue Recognition
Consistent with its practice since the fourth quarter of 1997, as a revenue
recognition policy, the Company reduces reported revenue (including both
interest and non-interest income components of reported revenue) for the
portion of finance charge and fees billed to customers that it deems
uncollectible. In addition, the Company reduces consumer loans outstanding
for such uncollectible amounts. As discussed below, the 2002 change in
recoveries estimate resulted in an $82.7 million reduction of finance charges
and fees deemed uncollectible for the year ended December 31, 2002.
Change in Recoveries Classification
During 2002, the Company changed its financial statement presentation of
recoveries of charged-off loans. The change was made in response to
guidelines that were published by the Federal Financial Institutions
Examination Council (“FFIEC”) with respect to credit card account
management. Previously, the Company recognized all recoveries of charged-
off loans in the allowance for loan losses and provision for loan losses. The
Company now classifies the portion of recoveries related to finance charges
and fees as revenue. All prior period recoveries have been reclassified to
conform to the current financial statement presentation of recoveries. This
reclassification had no impact on prior period earnings.
The change in the classification of recoveries resulted in a change to the
recoveries estimate used as part of the calculation of the Company’s allowance
for loan losses and finance charge and fee revenue. The change in the
recoveries estimate resulted in an increase to the allowance for loan losses and
a reduction of the amount of finance charges and fees deemed uncollectible
under the Company’s revenue recognition policy for the year ended
December 31, 2002. The change in estimate resulted in an increase of $38.4
million (pre-tax) to interest income and $44.4 million (pre-tax) to non-
interest income offset by an increase in the provision for loan losses of $133.4
million (pre-tax) for the year ended December 31, 2002. Therefore, net
income for the year ended December 31, 2002, was negatively impacted by
$31.4 million or $.14 per diluted share as a result of the change in estimate.
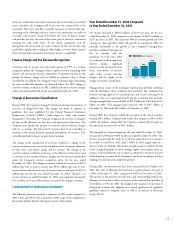
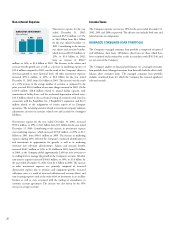
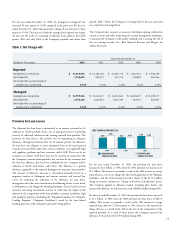
CONSOLIDATED EARNINGS SUMMARY
The following discussion provides a summary of 2002 results compared to
2001 results and 2001 results compared to 2000 results. Each component is
discussed in further detail in subsequent sections of this analysis.
NET INCOME ($ in millions)
900
20022001
642
2000
470