Capital One 2002 Annual Report Download - page 28
Download and view the complete annual report
Please find page 28 of the 2002 Capital One annual report below. You can navigate through the pages in the report by either clicking on the pages listed below, or by using the keyword search tool below to find specific information within the annual report.-
 1
1 -
2
-
3
-
4
-
5
-
6
-
7
-
8
-
9
-
10
-
11
-
12
-
13
-
14
-
15
-
16
-
17
-
 18
18 -
 19
19 -
 20
20 -
 21
21 -
 22
22 -
 23
23 -
 24
24 -
 25
25 -
 26
26 -
 27
27 -
 28
28 -
 29
29 -
 30
30 -
 31
31 -
 32
32 -
 33
33 -
 34
34 -
 35
35 -
 36
36 -
 37
37 -
 38
38 -
39
-
40
-
41
-
42
-
43
-
44
-
45
-
46
-
47
-
48
-
49
-
50
-
51
-
52
-
53
-
54
-
55
-
56
-
57
-
58
-
59
-
60
-
61
-
62
-
63
-
64
-
65
-
66
-
67
-
68
-
69
-
70
-
71
-
72
-
73
-
74
-
75
-
76
-
77
-
78
-
79
-
80
-
81
 |
 |

26
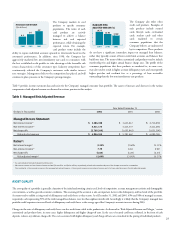
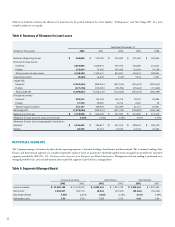
Income Taxes
The Company’s income tax rate was 38% for the years ended December 31,
2002, 2001 and 2000, respectively. The effective rate includes both state and
federal income tax components.
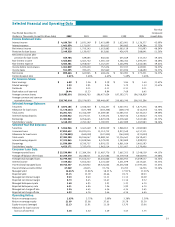
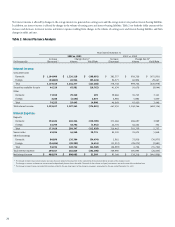
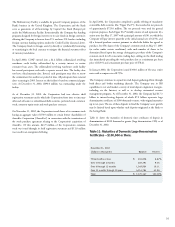
MANAGED CONSUMER LOAN PORTFOLIO
The Company’s managed consumer loan portfolio is comprised of reported
and off-balance sheet loans. Off-balance sheet loans are those which have
been securitized and accounted for as sales in accordance with SFAS 140, and
are not assets of the Company.
The Company analyzes its financial performance on a managed consumer
loan portfolio basis. Managed consumer loan data adds back the effect of off-
balance sheet consumer loans. The managed consumer loan portfolio
includes securitized loans for which the Company has retained significant
risks and rewards.
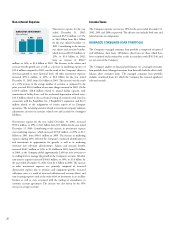
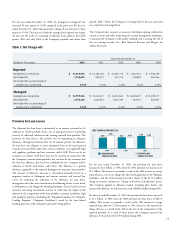
Non-Interest Expense
Non-interest expense for the year
ended December 31, 2002,
increased $527.6 million, or 13%,
to $4.6 billion from $4.1 billion
for the year ended December 31,
2001. Contributing to the increase
was salaries and associate benefits,
which increased $165.8 million, or
12%, to $1.6 billion in 2002,
from an increase of $368.7
million, or 36%, to $1.4 billion in 2001. The decrease in the salaries and
associate benefit growth rate as well as a decrease in marketing expenses of
$12.4 million compared to 2001, was the result of the Company’s efforts to
slow loan growth to more historical levels. All other non-interest expenses
increased $374.1 million, or 24%, to $2.0 billion for the year ended
December 31, 2002, from $1.6 billion in 2001. This increase was the result
of a 23% increase in the average number of accounts as compared to the
prior year and $110.0 million of one-time charges incurred in 2002. Of the
$110.0 million: $38.8 million related to unused facility capacity, early
termination of facility leases, and the accelerated depreciation of fixed assets;
$14.5 million related to the accelerated vesting of restricted stock issued in
connection with the PeopleFirst, Inc. (“PeopleFirst”) acquisition; and $12.5
million related to the realignment of certain aspects of its European
operations. The remaining amounts related to investment company valuation
adjustments, increases in associate related costs and accruals for contingent
liabilities.
Non-interest expense for the year ended December 31, 2001, increased
$910.4 million, or 29%, to $4.1 billion from $3.1 billion for the year ended
December 31, 2000. Contributing to the increase in non-interest expense
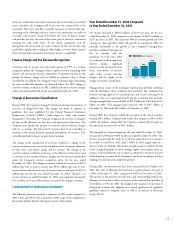
were marketing expenses, which increased $176.8 million, or 20%, to $1.1
billion in 2001, from $906.1 million in 2000. The increase in marketing
expenses during 2001 reflected the Company’s continued identification of
and investments in opportunities for growth, as well as its marketing
extension into television advertisements. Salaries and associate benefits
increased $368.7 million, or 36%, to $1.4 billion in 2001, from $1.0 billion
in 2000, as the Company added approximately 2,400 net new associates to
its staffing levels to manage the growth in the Company’s accounts. All other
non-interest expenses increased $364.8 million, or 30%, to $1.6 billion for
the year ended December 31, 2001, from $1.2 billion in 2000. The increase
in other non-interest expenses was primarily composed of increased
depreciation expense due to premises and equipment growth, increased
collections costs as a result of increased collection and recovery efforts, and
non-recurring expenses such as the write-off of an investment in an ancillary
business as well as costs associated with the mailing of amendments to
customer account agreements. The increase was also driven by the 39%
increase in average accounts.
MARKETING INVESTMENT
($ in millions)
1,071
20022001
1,083
2000
906