Capital One 2002 Annual Report Download - page 64
Download and view the complete annual report
Please find page 64 of the 2002 Capital One annual report below. You can navigate through the pages in the report by either clicking on the pages listed below, or by using the keyword search tool below to find specific information within the annual report.-
 1
1 -
2
-
3
-
4
-
5
-
6
-
7
-
8
-
9
-
10
-
11
-
12
-
13
-
14
-
15
-
16
-
17
-
18
-
19
-
20
-
21
-
22
-
23
-
24
-
25
-
26
-
27
-
28
-
29
-
30
-
31
-
32
-
33
-
34
-
35
-
36
-
37
-
38
-
39
-
40
-
41
-
42
-
43
-
44
-
45
-
46
-
47
-
48
-
49
-
50
-
51
-
52
-
53
-
 54
54 -
 55
55 -
 56
56 -
 57
57 -
 58
58 -
 59
59 -
 60
60 -
 61
61 -
 62
62 -
 63
63 -
 64
64 -
 65
65 -
 66
66 -
 67
67 -
 68
68 -
 69
69 -
 70
70 -
 71
71 -
 72
72 -
 73
73 -
 74
74 -
75
-
76
-
77
-
78
-
79
-
80
-
81
 |
 |

62
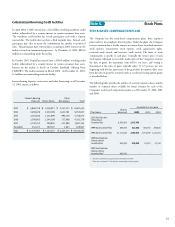
A summary of the status of the Company’s options as of December 31, 2002, 2001 and 2000, and changes for the years then ended is presented below:
2002 2001 2000
Weighted- Weighted- Weighted-
Options Average Exercise Options Average Exercise Options Average Exercise
(000s) Price Per Share (000s) Price Per Share (000s) Price Per Share
Outstanding at beginning of year 49,180 $ 40.74 36,689 $ 30.57 37,058 $ 27.24
Granted 6,631 36.52 20,148 49.84 4,063 51.14
Exercised (1,623) 27.19 (6,950) 12.29 (3,330) 12.20
Cancelled (2,080) 53.31 (707) 55.89 (1,102) 49.79
Outstanding at end of year 52,108 $ 40.06 49,180 $ 40.74 36,689 $ 30.57
Exercisable at end of year 23,340 $ 30.20 18,714 $ 23.25 22,108 $ 16.48
Weighted-average fair value of options
granted during the year $ 16.53 $ 29.73 $ 23.41
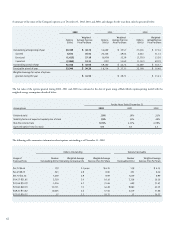
The fair value of the options granted during 2002, 2001 and 2000 was estimated at the date of grant using a Black-Scholes option-pricing model with the
weighted average assumptions described below:
For the Years Ended December 31
Assumptions 2002 2001 2000
Dividend yield .25% .19% .21%
Volatility factors of expected market price of stock 55% 50% 49%
Risk-free interest rate 3.15% 4.15% 6.09%
Expected option lives (in years) 5.0 8.5 4.5
The following table summarizes information about options outstanding as of December 31, 2002:
Options Outstanding Options Exercisable
Range of Number Weighted-Average Weighted-Average Number Weighted-Average
Exercise Prices Outstanding (000s) Remaining Contractual Life Exercise Price Per Share Exercisable (000s) Exercise Price Per Share
$4.31-$6.46 139 2.1 years $ 6.15 139 $ 6.15
$6.47-$9.70 223 2.9 8.00 223 8.00
$9.71-$14.56 7,659 2.9 9.99 7,659 9.99
$14.57-$21.85 2,318 5.0 16.16 2,318 16.16
$21.86-$32.79 1,016 6.7 31.66 689 31.63
$32.80-$49.20 30,731 7.0 44.29 9,880 43.05
$49.21-$73.82 10,005 6.6 57.58 2,419 57.88
$73.83-$76.37 17 5.2 76.37 13 76.37