Capital One 2002 Annual Report Download - page 5
Download and view the complete annual report
Please find page 5 of the 2002 Capital One annual report below. You can navigate through the pages in the report by either clicking on the pages listed below, or by using the keyword search tool below to find specific information within the annual report.-
 1
1 -
 2
2 -
 3
3 -
 4
4 -
 5
5 -
 6
6 -
 7
7 -
 8
8 -
 9
9 -
 10
10 -
 11
11 -
 12
12 -
 13
13 -
 14
14 -
 15
15 -
 16
16 -
17
-
18
-
19
-
20
-
21
-
22
-
23
-
24
-
25
-
26
-
27
-
28
-
29
-
30
-
31
-
32
-
33
-
34
-
35
-
36
-
37
-
38
-
39
-
40
-
41
-
42
-
43
-
44
-
45
-
46
-
47
-
48
-
49
-
50
-
51
-
52
-
53
-
54
-
55
-
56
-
57
-
58
-
59
-
60
-
61
-
62
-
63
-
64
-
65
-
66
-
67
-
68
-
69
-
70
-
71
-
72
-
73
-
74
-
75
-
76
-
77
-
78
-
79
-
80
-
81
 |
 |
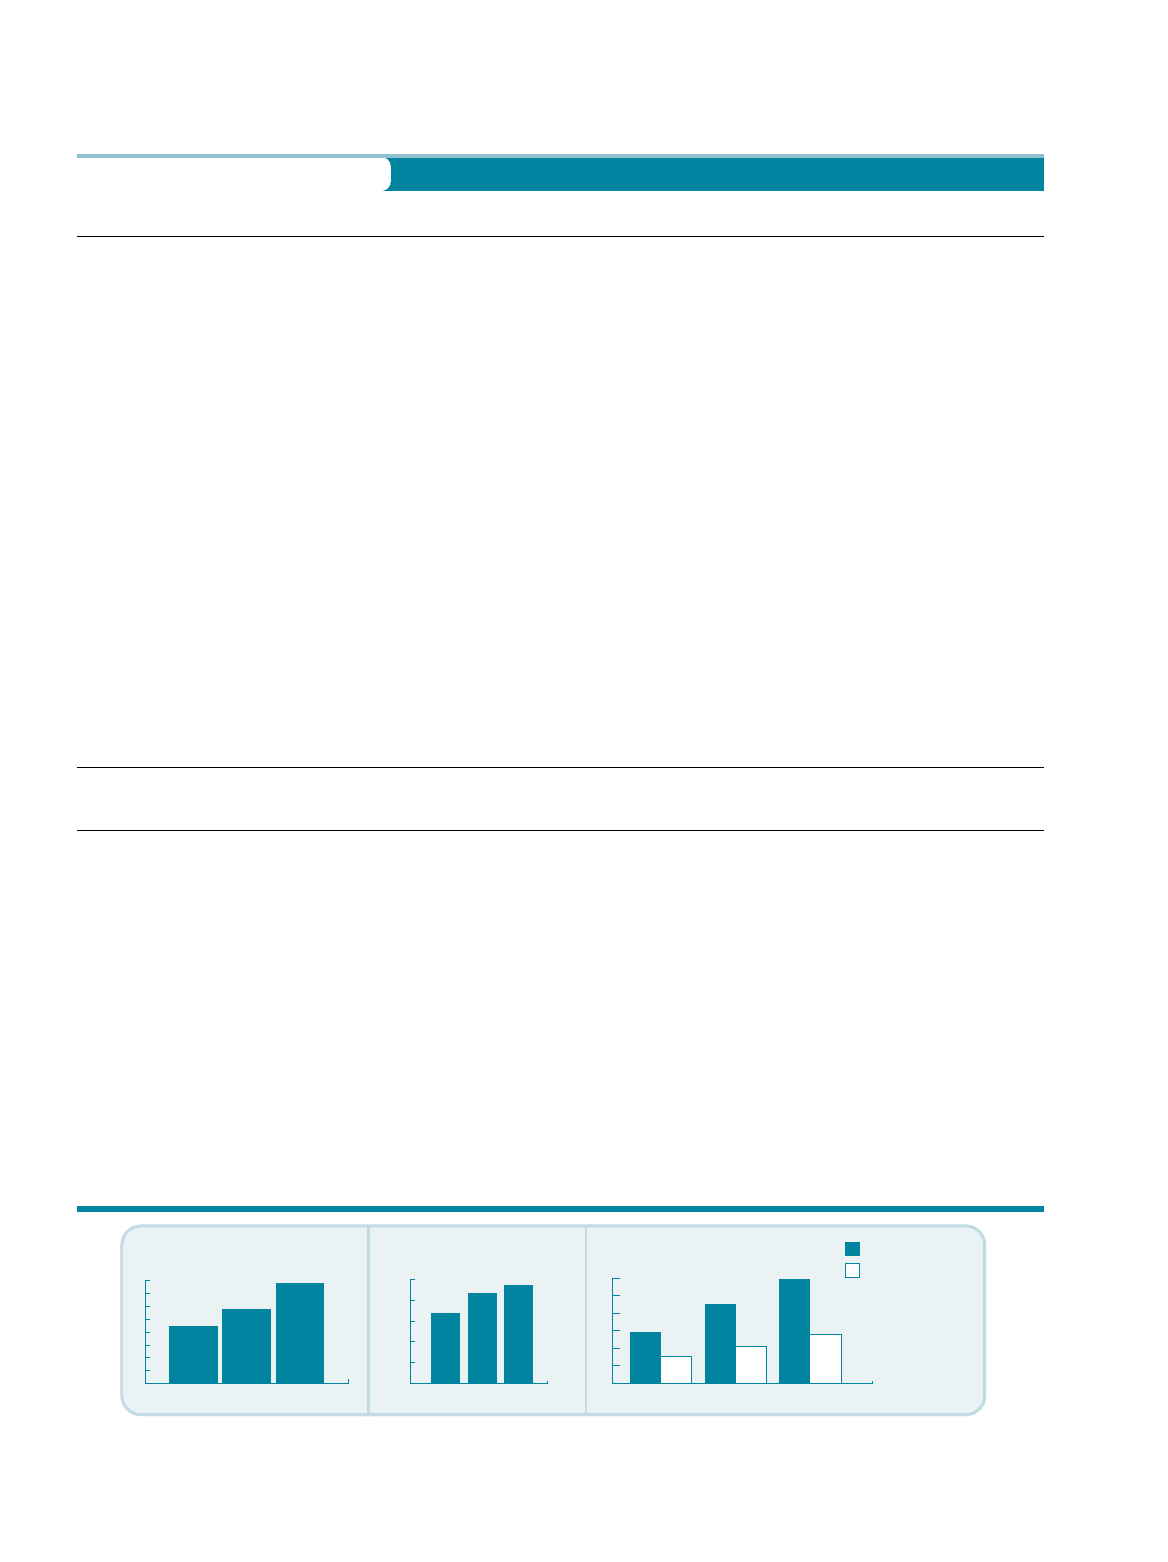
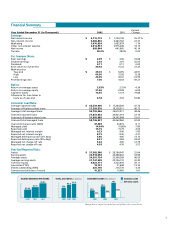
DILUTED EARNINGS PER SHARE
$3.93
20022001
$2.91
2000
$2.24
TOTAL ACCOUNTS (in millions)
33.8
2000
43.8
2001
47.4
2002
MANAGED LOANS
REPORTED LOANS
CONSUMER LOANS ($ in billions)
59.7
27.9
2002
45.3
20.9
2001
29.5
15.1
2000
Financial Summary
Percent
Year Ended December 31 (In Thousands) 2002 2001 Change
Earnings:
Net interest income $ 2,719,112 $ 1,750,142 55.37 %
Non-interest income 5,466,836 4,463,762 22.47
Marketing 1,070,624 1,082,979 -1.14
Other non-interest expense 3,514,957 2,975,048 18.15
Net income 899,644 641,965 40.14
Tax rate 38.0% 38.0% 0.00
Per Common Share:
Basic earnings $ 4.09 $ 3.06 33.66
Diluted earnings 3.93 2.91 35.05
Dividends 0.11 0.11 0.00
Book value as of year-end 20.44 15.33 33.33
Market prices
Year-end $ 29.72 $ 53.95 -44.91
High 66.50 72.58 -8.38
Low 24.05 36.41 -33.95
Price/Earnings ratio 7.56 18.54 -59.21
Ratios:
Return on average assets 2.63% 2.75% -4.34
Return on average equity 21.69 23.08 -6.04
Capital to assets 14.55 12.14 19.88
Allowance for loan losses to
loans as of year-end 6.18 4.02 53.80
Consumer Loan Data:
Average reported loans $ 25,539,996 $ 17,284,306 47.76
Average off-balance sheet loans 27,259,570 18,328,011 48.73
Average total managed loans 52,799,566 35,612,317 48.26
Year-end reported loans 27,853,652 20,921,014 33.14
Year-end off-balance sheet loans 31,892,885 24,342,949 31.01
Year-end total managed loans 59,746,537 45,263,963 32.00
Year-end total accounts (000s) 47,369 43,815 8.11
Managed yield 14.64% 15.88% -7.80
Reported yield 15.15 15.79 -4.05
Managed net interest margin 9.23 9.40 -1.85
Reported net interest margin 8.73 8.45 -3.31
Managed delinquency rate (30+ days) 5.60 4.95 13.13
Reported delinquency rate (30+ days) 6.51 4.84 34.50
Managed net charge-off rate 5.24 4.65 12.79
Reported net charge-off rate 4.93 4.76 3.57
Year-End Reported Data:
Assets $ 37,382,380 $ 28,184,047 32.64
Earning assets 32,918,598 24,388,463 34.98
Average assets 34,201,724 23,346,309 46.50
Average earning assets 31,147,599 20,706,172 50.43
Common equity 4,623,171 3,323,478 39.11
Associates (FTE's) 18,757 21,648 -13.35
Shares outstanding (000s) 226,195 216,778 4.34
Common stockholders of record 10,227 10,065 1.61
3
Managed loans are comprised of reported loans and off-balance sheet securitized loans.