Capital One 2002 Annual Report Download - page 26
Download and view the complete annual report
Please find page 26 of the 2002 Capital One annual report below. You can navigate through the pages in the report by either clicking on the pages listed below, or by using the keyword search tool below to find specific information within the annual report.-
 1
1 -
2
-
3
-
4
-
5
-
6
-
7
-
8
-
9
-
10
-
11
-
12
-
13
-
14
-
15
-
 16
16 -
 17
17 -
 18
18 -
 19
19 -
 20
20 -
 21
21 -
 22
22 -
 23
23 -
 24
24 -
 25
25 -
 26
26 -
 27
27 -
 28
28 -
 29
29 -
 30
30 -
 31
31 -
 32
32 -
 33
33 -
 34
34 -
 35
35 -
 36
36 -
37
-
38
-
39
-
40
-
41
-
42
-
43
-
44
-
45
-
46
-
47
-
48
-
49
-
50
-
51
-
52
-
53
-
54
-
55
-
56
-
57
-
58
-
59
-
60
-
61
-
62
-
63
-
64
-
65
-
66
-
67
-
68
-
69
-
70
-
71
-
72
-
73
-
74
-
75
-
76
-
77
-
78
-
79
-
80
-
81
 |
 |

24
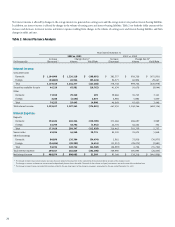
Net interest income is affected by changes in the average interest rate generated on earning assets and the average interest rate paid on interest-bearing liabilities.
In addition, net interest income is affected by changes in the volume of earning assets and interest-bearing liabilities. Table 2 sets forth the dollar amount of the
increases and decreases in interest income and interest expense resulting from changes in the volume of earning assets and interest-bearing liabilities and from
changes in yields and rates.
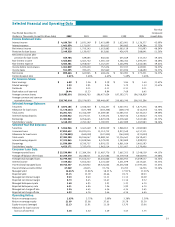
Table 2: Interest Variance Analysis
Year Ended December 31
2002 vs. 2001 2001 vs. 2000
Increase Change due to(1) Increase Change due to(1)
(In thousands) (Decrease)
(2) Volume Yield/Rate (Decrease) Volume Yield/Rate
Interest Income:
Consumer loans
Domestic $ 1,164,006 $ 1,236,218 $ (108,991) $ 282,377 $ 958,328 $ (675,951)
Foreign (24,861) 26,966 (53,424) 96,371 66,904 29,467
Total 1,139,145 1,244,377 (143,608) 378,748 999,726 (620,978)
Securities available for sale 46,219 65,981 (19,762) 41,634 50,678 (9,044)
Other
Domestic 71,013 70,320 693 39,884 36,743 3,141
Foreign 3,240 (1,633) 4,873 6,984 5,984 1,000
Total 74,253 59,445 14,808 46,868 43,420 3,448
Total interest income 1,259,617 1,397,242 (176,001) 467,250 1,149,366 (682,116)
Interest Expense:
Deposits
Domestic 154,626 265,326 (110,700) 271,686 268,697 2,989
Foreign 16,793 18,734 (1,941) 44,776 44,422 354
Total 171,419 284,347 (112,928) 316,462 310,709 5,753
Senior notes 65,034 44,260 20,774 82,520 76,672 5,848
Other borrowings
Domestic 80,890 135,364 (54,474) 2,961 33,938 (30,977)
Foreign (26,696) (20,282) (6,414) (31,953) (28,072) (3,881)
Total 54,194 120,762 (66,568) (28,992) 6,708 (35,700)
Total interest expense 290,647 482,845 (192,198) 369,990 395,995 (26,005)
Net interest income $ 968,970 $ 898,085 $ 32,509 $ 97,260 $ 739,218 $ (641,958)
(1) The change in interest due to both volume and rates has been allocated in proportion to the relationship of the absolute dollar amounts of the change in each.
The changes in income and expense are calculated independently for each line in the table. The totals for the volume and yield/rate columns are not the sum of the individual lines.
(2) The change in interest income includes $38.4 million related to the one-time impact of the change in recoveries assumption for the year ended December 31, 2002.