Capital One 2002 Annual Report Download - page 52
Download and view the complete annual report
Please find page 52 of the 2002 Capital One annual report below. You can navigate through the pages in the report by either clicking on the pages listed below, or by using the keyword search tool below to find specific information within the annual report.-
 1
1 -
2
-
3
-
4
-
5
-
6
-
7
-
8
-
9
-
10
-
11
-
12
-
13
-
14
-
15
-
16
-
17
-
18
-
19
-
20
-
21
-
22
-
23
-
24
-
25
-
26
-
27
-
28
-
29
-
30
-
31
-
32
-
33
-
34
-
35
-
36
-
37
-
38
-
39
-
40
-
41
-
 42
42 -
 43
43 -
 44
44 -
 45
45 -
 46
46 -
 47
47 -
 48
48 -
 49
49 -
 50
50 -
 51
51 -
 52
52 -
 53
53 -
 54
54 -
 55
55 -
 56
56 -
 57
57 -
 58
58 -
 59
59 -
 60
60 -
 61
61 -
 62
62 -
63
-
64
-
65
-
66
-
67
-
68
-
69
-
70
-
71
-
72
-
73
-
74
-
75
-
76
-
77
-
78
-
79
-
80
-
81
 |
 |
50
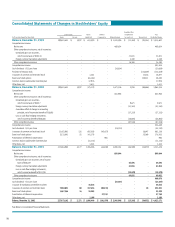
Consolidated Statements of Changes in Stockholders’ Equity
Cumulative Other
Common Stock Paid-In Deferred Comprehensive Total
(In Thousands, Except Per Share Data) Shares Amount Capital, Net Compensation Retained Earnings Income (Loss) TreasuryStock Stockholders’ Equity
Balance, December 31, 1999
199,670,421 $ 1,997 $ 613,590 $ - $ 1,022,296 $ (31,262) $ (91,014) $ 1,515,607
Comprehensive income:
Net income - - - - 469,634 - - 469,634
Other comprehensive income, net of income tax:
Unrealized gains on securities,
net of income taxes of $19,510 - - - - - 31,831 - 31,831
Foreign currency translation adjustments - - - - - 2,349 - 2,349
Other comprehensive income - - - - - 34,180 - 34,180
Comprehensive income - - - - - - - 503,814
Cash dividends - $.11 per share - - - - (20,824) - - (20,824)
Purchase of treasury stock - - - - - - (134,619) (134,619)
Issuances of common and restricted stock - - 1,441 - - - 17,436 18,877
Exercise of stock options - - (61,261) - - - 119,511 58,250
Common stock issuable under incentive plan - - 17,976 - - - - 17,976
Other items, net - - 3,433 - - - - 3,433
Balance, December 31, 2000
199,670,421 1,997 575,179 - 1,471,106 2,918 (88,686) 1,962,514
Comprehensive income:
Net income - - - - 641,965 - - 641,965
Other comprehensive income, net of income tax:
Unrealized gains on securities,
net of income taxes of $5,927 - - - - - 9,671 - 9,671
Foreign currency translation adjustments - - - - - (23,161) - (23,161)
Cumulative effect of change in accounting
principle, net of income tax benefit of $16,685 - - - - - (27,222) - (27,222)
Loss on cash flow hedging instruments,
net of income tax benefit of $28,686 - - - - - (46,804) - (46,804)
Other comprehensive loss - - - - - (87,516) - (87,516)
Comprehensive income - - - - - - - 554,449
Cash dividends - $.11 per share - - - - (22,310) - - (22,310)
Issuances of common and restricted stock 12,453,961 125 687,828 (45,472) - - 18,647 661,128
Exercise of stock options 5,532,603 55 141,178 - - - 35,069 176,302
Amortization of deferred compensation - - - 984 - - - 984
Common stock issuable under incentive plan - - (11,134) - - - - (11,134)
Other items, net - - 1,545 - - - - 1,545
Balance, December 31, 2001
217,656,985 2,177 1,394,596 (44,488) 2,090,761 (84,598) (34,970) 3,323,478
Comprehensive income:
Net income - - - - 899,644 -- 899,644
Other comprehensive income, net of income tax:
Unrealized gains on securities, net of income
taxes of $28,619 - - - - - 46,694 - 46,694
Foreign currency translation adjustments - - - - - 41,816 - 41,816
Loss on cash flow hedging instruments,
net of income tax benefit of $11,938 - - - - - (19,478) - (19,478)
Other comprehensive income - - - - - 69,032 - 69,032
Comprehensive income - - - - - - - 968,676
Cash dividends - $.11 per share - - - - (23,457) - - (23,457)
Issuance of mandatory convertible securities - - 36,616 - - - - 36,616
Issuances of common and restricted stock 7,968,831 80 317,454 (85,231) - - 18 232,321
Exercise of stock options 1,447,346 14 55,585 ----55,599
Amortization of deferred compensation - - - 27,749 - - - 27,749
Other items, net - - 2,189 - - - - 2,189
Balance, December 31, 2002 227,073,162 $ 2,271 $ 1,806,440 $ (101,970) $ 2,966,948 $ (15,566) $ (34,952) $ 4,623,171
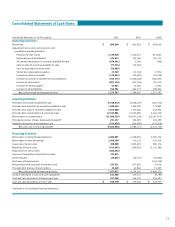
See Notes to Consolidated Financial Statements.