Capital One 2002 Annual Report Download - page 51
Download and view the complete annual report
Please find page 51 of the 2002 Capital One annual report below. You can navigate through the pages in the report by either clicking on the pages listed below, or by using the keyword search tool below to find specific information within the annual report.-
 1
1 -
2
-
3
-
4
-
5
-
6
-
7
-
8
-
9
-
10
-
11
-
12
-
13
-
14
-
15
-
16
-
17
-
18
-
19
-
20
-
21
-
22
-
23
-
24
-
25
-
26
-
27
-
28
-
29
-
30
-
31
-
32
-
33
-
34
-
35
-
36
-
37
-
38
-
39
-
40
-
 41
41 -
 42
42 -
 43
43 -
 44
44 -
 45
45 -
 46
46 -
 47
47 -
 48
48 -
 49
49 -
 50
50 -
 51
51 -
 52
52 -
 53
53 -
 54
54 -
 55
55 -
 56
56 -
 57
57 -
 58
58 -
 59
59 -
 60
60 -
 61
61 -
62
-
63
-
64
-
65
-
66
-
67
-
68
-
69
-
70
-
71
-
72
-
73
-
74
-
75
-
76
-
77
-
78
-
79
-
80
-
81
 |
 |
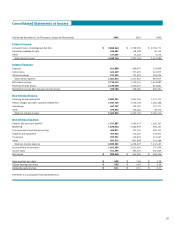
Consolidated Statements of Income
Year Ended December 31 (In Thousands, Except Per Share Data) 2002 2001 2000
Interest Income:
Consumer loans, including past-due fees $ 3,868,664 $ 2,729,519 $ 2,350,771
Securities available for sale 184,407 138,188 96,554
Other 127,695 53,442 6,574
Total interest income 4,180,766 2,921,149 2,453,899
Interest Expense:
Deposits 811,889 640,470 324,008
Senior notes 422,529 357,495 274,975
Other borrowings 227,236 173,042 202,034
Total interest expense 1,461,654 1,171,007 801,017
Net interest income 2,719,112 1,750,142 1,652,882
Provision for loan losses 2,149,328 1,120,457 812,861
Net interest income after provision for loan losses 569,784 629,685 840,021
Non-Interest Income:
Servicing and securitizations 2,805,501 2,441,144 1,152,375
Service charges and other customer-related fees 1,937,735 1,536,338 1,646,588
Interchange 447,747 379,797 237,777
Other 275,853 106,483 28,370
Total non-interest income 5,466,836 4,463,762 3,065,110
Non-Interest Expense:
Salaries and associate benefits 1,557,887 1,392,072 1,023,367
Marketing 1,070,624 1,082,979 906,147
Communications and data processing 406,071 327,743 296,255
Supplies and equipment 357,953 310,310 252,937
Occupancy 205,531 136,974 112,667
Other 987,515 807,949 556,284
Total non-interest expense 4,585,581 4,058,027 3,147,657
Income before income taxes 1,451,039 1,035,420 757,474
Income taxes 551,395 393,455 287,840
Net income $ 899,644 $ 641,965 $ 469,634
Basic earnings per share $ 4.09 $ 3.06 $ 2.39
Diluted earnings per share $ 3.93 $ 2.91 $ 2.24
Dividends paid per share $ 0.11 $ 0.11 $ 0.11
See Notes to Consolidated Financial Statements.
49