Capital One 2002 Annual Report Download - page 47
Download and view the complete annual report
Please find page 47 of the 2002 Capital One annual report below. You can navigate through the pages in the report by either clicking on the pages listed below, or by using the keyword search tool below to find specific information within the annual report.-
 1
1 -
2
-
3
-
4
-
5
-
6
-
7
-
8
-
9
-
10
-
11
-
12
-
13
-
14
-
15
-
16
-
17
-
18
-
19
-
20
-
21
-
22
-
23
-
24
-
25
-
26
-
27
-
28
-
29
-
30
-
31
-
32
-
33
-
34
-
35
-
36
-
 37
37 -
 38
38 -
 39
39 -
 40
40 -
 41
41 -
 42
42 -
 43
43 -
 44
44 -
 45
45 -
 46
46 -
 47
47 -
 48
48 -
 49
49 -
 50
50 -
 51
51 -
 52
52 -
 53
53 -
 54
54 -
 55
55 -
 56
56 -
 57
57 -
58
-
59
-
60
-
61
-
62
-
63
-
64
-
65
-
66
-
67
-
68
-
69
-
70
-
71
-
72
-
73
-
74
-
75
-
76
-
77
-
78
-
79
-
80
-
81
 |
 |
45
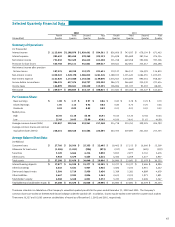
Selected Quarterly Financial Data
2002 2001
Fourth Third Second First Fourth Third Second First
(Unaudited) Quarter Quarter Quarter Quarter Quarter Quarter Quarter Quarter
Summary of Operations:
(In Thousands)
Interest income $ 1,113,664 $ 1,108,079 $ 1,024,661 $ 934,361 $ 826,606 $ 743,927 $ 679,154 $ 671,462
Interest expense 382,632 385,650 370,249 323,123 314,838 294,869 287,146 274,154
Net interest income 731,032 722,429 654,412 611,238 511,768 449,058 392,008 397,308
Provision for loan losses 543,758 674,111 541,841 389,617 339,641 262,901 235,417 282,498
Net interest income after provision
for loan losses 187,274 48,318 112,571 221,621 172,127 186,157 156,591 114,810
Non-interest income 1,320,322 1,520,178 1,384,812 1,241,524 1,189,015 1,155,421 1,084,255 1,035,071
Non-interest expense 1,121,020 1,151,020 1,153,646 1,159,895 1,074,567 1,074,897 990,316 918,247
Income before income taxes 386,576 417,476 343,737 303,250 286,575 266,681 250,530 231,634
Income taxes 146,899 158,641 130,620 115,235 108,894 101,337 95,203 88,021
Net income $ 239,677 $ 258,835 $ 213,117 $ 188,015 $ 177,681 $ 165,344 $ 155,327 $ 143,613
Per Common Share:
Basic earnings $ 1.08 $ 1.17 $ 0.97 $ 0.86 $ 0.83 $ 0.78 $ 0.74 $ 0.70
Diluted earnings 1.05 1.13 0.92 0.83 0.80 0.75 0.70 0.66
Dividends 0.03 0.03 0.03 0.03 0.03 0.03 0.03 0.03
Market prices
High 36.50 61.10 66.50 64.91 55.60 67.25 72.58 70.44
Low 25.49 24.05 52.00 43.01 41.00 36.41 51.61 46.90
Average common shares (000s) 221,807 220,564 219,961 217,548 214,718 210,763 209,076 204,792
Average common shares and common
equivalent shares (000s) 228,214 228,418 231,684 226,605 223,350 219,897 221,183 217,755
Average Balance Sheet Data:
(In Millions)
Consumer loans $ 27,766 $ 26,566 $ 25,353 $ 22,405 $ 19,402 $ 17,515 $ 16,666 $ 15,509
Allowance for loan losses (1,596) (1,241) (994) (873) (747) (660) (605) (539)
Securities 5,120 4,666 4,216 3,850 3,943 2,977 2,741 2,478
Other assets 5,918 5,479 5,465 4,614 4,382 4,059 3,277 2,907
Total assets $ 37,208 $ 35,470 $ 34,040 $ 29,996 $ 26,980 $ 23,891 $ 22,079 $ 20,355
Interest-bearing deposits $ 17,077 $ 16,520 $ 15,277 $ 13,505 $ 12,237 $ 10,537 $ 9,686 $ 8,996
Other borrowings 6,332 5,631 5,947 4,926 3,496 3,103 2,915 2,442
Senior and deposit notes 5,564 5,719 5,959 5,430 5,389 5,281 4,899 4,679
Other liabilities 3,667 3,182 2,836 2,563 2,635 2,035 1,971 1,891
Stockholder’s equity 4,568 4,418 4,021 3,572 3,223 2,935 2,608 2,347
Total liabilities and stockholders’ equity $ 37,208 $ 35,470 $ 34,040 $ 29,996 $ 26,980 $ 23,891 $ 22,079 $ 20,355
The above schedule is a tabulation of the Company’s unaudited quarterly results for the years ended December 31, 2002 and 2001. The Company’s
common shares are traded on the New York Stock Exchange under the symbol COF. In addition, shares may be traded in the over-the-counter stock market.
There were 10,227 and 10,065 common stockholders of record as of December 31, 2002 and 2001, respectively.