Capital One 2002 Annual Report Download - page 34
Download and view the complete annual report
Please find page 34 of the 2002 Capital One annual report below. You can navigate through the pages in the report by either clicking on the pages listed below, or by using the keyword search tool below to find specific information within the annual report.-
 1
1 -
2
-
3
-
4
-
5
-
6
-
7
-
8
-
9
-
10
-
11
-
12
-
13
-
14
-
15
-
16
-
17
-
18
-
19
-
20
-
21
-
22
-
23
-
 24
24 -
 25
25 -
 26
26 -
 27
27 -
 28
28 -
 29
29 -
 30
30 -
 31
31 -
 32
32 -
 33
33 -
 34
34 -
 35
35 -
 36
36 -
 37
37 -
 38
38 -
 39
39 -
 40
40 -
 41
41 -
 42
42 -
 43
43 -
 44
44 -
45
-
46
-
47
-
48
-
49
-
50
-
51
-
52
-
53
-
54
-
55
-
56
-
57
-
58
-
59
-
60
-
61
-
62
-
63
-
64
-
65
-
66
-
67
-
68
-
69
-
70
-
71
-
72
-
73
-
74
-
75
-
76
-
77
-
78
-
79
-
80
-
81
 |
 |

32
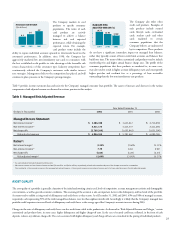
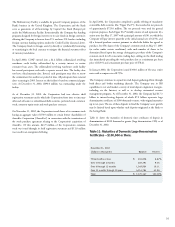
Table 8 sets forth the activity in the allowance for loan losses for the periods indicated. See “Asset Quality,” “Delinquencies” and “Net Charge-Offs” for a more
complete analysis of asset quality.
Table 8: Summary of Allowance for Loan Losses
Year Ended December 31
(Dollars in Thousands) 2002 2001 2000 1999 1998
Balance at beginning of year $ 840,000 $ 527,000 $ 342,000 $ 231,000 $ 183,000
Provision for loan losses:
Domestic 2,025,885 1,048,972 705,195 364,086 252,612
Foreign 123,443 71,485 107,666 62,384 36,229
Total provision for loan losses 2,149,328 1,120,457 812,861 426,470 288,841
Acquisitions/other (9,644) 14,800 (549 ) 3,522 7,503
Charge-offs:
Domestic (1,363,565) (908,065 ) (693,106 ) (344,679 ) (282,455)
Foreign (127,276) (110,285) (79,296 ) (55,464 ) (11,840)
Total charge-offs (1,490,841) (1,018,350 ) (772,402 ) (400,143 ) (294,295)
Principal recoveries:
Domestic 203,412 176,102 136,334 79,150 45,892
Foreign 27,745 19,991 8,756 2,001 59
Total principal recoveries 231,157 196,093 145,090 81,151 45,951
Net charge-offs (1,259,684) (822,257 ) (627,312 ) (318,992 ) (248,344)
Balance at end of year $ 1,720,000 $ 840,000 $ 527,000 $ 342,000 $ 231,000
Allowance for loan losses to loans at end of year 6.18% 4.02% 3.49% 3.45% 3.75%
Allowance for loan losses by geographic distribution:
Domestic $ 1,636,405 $ 784,857 $ 451,074 $ 299,424 $ 198,419
Foreign 83,595 55,143 75,926 42,576 32,581
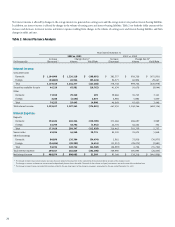
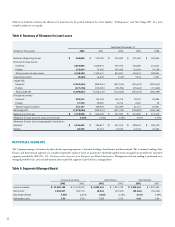
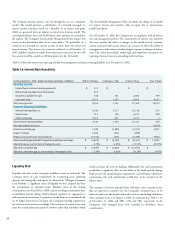
REPORTABLE SEGMENTS
The Company manages its business by three distinct operating segments: Consumer Lending, Auto Finance and International. The Consumer Lending, Auto
Finance and International segments are considered reportable segments based on quantitative thresholds applied to the managed loan portfolio for reportable
segments provided by SFAS No. 131, Disclosures about Segments of an Enterprise and Related Information. Management decision making is performed on a
managed portfolio basis, and such information about reportable segments is provided on a managed basis.
Table 9: Segments (Managed Basis)
Consumer Lending Auto Finance International
2002 2001 2002 2001 2002 2001
Loans receivable $ 47,290,100 $ 37,324,079 $ 6,992,541 $ 3,957,729 $ 5,330,541 $ 3,970,244
Net income 1,043,027 780,776 10,262 (35,361) (35,566) (50,454 )
Net charge-off rate 5.54% 4.87% 3.82% 4.25% 3.76% 3.59%
Delinquency rate 5.54 5.00 7.15 5.59 4.18 3.84