Capital One 2002 Annual Report Download - page 27
Download and view the complete annual report
Please find page 27 of the 2002 Capital One annual report below. You can navigate through the pages in the report by either clicking on the pages listed below, or by using the keyword search tool below to find specific information within the annual report.-
 1
1 -
2
-
3
-
4
-
5
-
6
-
7
-
8
-
9
-
10
-
11
-
12
-
13
-
14
-
15
-
16
-
 17
17 -
 18
18 -
 19
19 -
 20
20 -
 21
21 -
 22
22 -
 23
23 -
 24
24 -
 25
25 -
 26
26 -
 27
27 -
 28
28 -
 29
29 -
 30
30 -
 31
31 -
 32
32 -
 33
33 -
 34
34 -
 35
35 -
 36
36 -
 37
37 -
38
-
39
-
40
-
41
-
42
-
43
-
44
-
45
-
46
-
47
-
48
-
49
-
50
-
51
-
52
-
53
-
54
-
55
-
56
-
57
-
58
-
59
-
60
-
61
-
62
-
63
-
64
-
65
-
66
-
67
-
68
-
69
-
70
-
71
-
72
-
73
-
74
-
75
-
76
-
77
-
78
-
79
-
80
-
81
 |
 |

25
Service charges and other customer-related fees decreased by $110.3 million,
or 7%, to $1.5 billion for the year ended December 31, 2001. This decrease
was primarily due to the shift in the mix of the reported loan portfolio
toward a greater composition of lower fee-generating loans, offset by a 39%
increase in the average number of accounts in 2001.
Interchange Income
Interchange income increased $68.0 million, or 18%, to $447.8 million for
the year ended December 31, 2002, from $379.8 million in 2001. This
increase is primarily attributable to an increase in annual purchase volume.
Total interchange income is net of $104.9 million of costs related to the
Company’s rewards programs for the year ended December 31, 2002.
Interchange income increased $142.0 million, or 60%, to $379.8 million for
the year ended December 31, 2001, from $237.8 million in 2000. This
increase was a result of increased annual purchase volume and new account
growth for the year ended December 31, 2001. Total interchange income
was net of $110.9 of costs related to the Company’s rewards programs for the
year ended December 31, 2001.
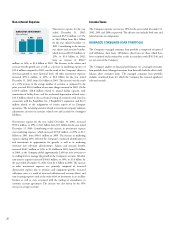
Other Non-Interest Income
Other non-interest income includes gains on sale of securities, gains related
to the repurchase of senior notes, gains or losses associated with hedging
transactions, service provider revenue generated by the Company’s medical
procedures lending business and income earned related to the reaffirmation
of purchased charged-off loan portfolios.
Other non-interest income increased $169.4 million or 159% to $275.9
million for 2002 compared to $106.5 million for 2001. The increase in other
non-interest income was primarily due to $77.5 million of gains on sales of
securities realized in 2002 in connection with the Company’s rebalancing of
its liquidity portfolio compared to $13.5 million realized in 2001. Other
factors in the increase included gains related to senior note repurchases of
$27.0 million realized during 2002, an increase in service provider revenue of
$9.4 million and an increase in income earned from reaffirmed purchased
charged-off loans of $24.1 million during the year ended December 31,
2002.
Other non-interest income increased $78.1 million or 275% to $106.5
million for 2001 compared to $28.4 million in 2000. The increase was
primarily due to an increase in income earned on reaffirmed purchased
charged-off loans of $26.2 million, gains on sales of securities earned in 2001
of $13.5 million compared with no gains in 2000 and a $16.3 million
increase in service provider revenue generated by the Company’s medical
procedures lending business.
Servicing and Securitization Income
In accordance with SFAS 140, the Company records gains or losses on the off-
balance sheet securitizations of consumer loan receivables on the date of sale
based on the estimated fair value of assets sold and retained and liabilities
incurred in the sale. Retained interests in securitized assets include interest-
only strips, retained subordinated interests in the transferred pool of
receivables, cash collateral accounts and accrued interest and fees on the
investors’ share of the pool of receivables. Gains represent the present value of
estimated excess cash flows the Company will receive over the estimated life of
the receivables and are included in servicing and securitizations income. This
excess cash flow essentially represents an interest-only strip, consisting of the
following estimates: the excess of finance charges and past-due fees over the
sum of the return paid to investors, contractual servicing fees and credit losses.
The credit risk exposure on retained interests exceeds the pro rata share of the
Company’s interest in the pool of receivables. However, exposure to credit
losses on the securitized loans is contractually limited to the retained interests.
Servicing and securitizations income represents servicing fees, excess spread
and other fees relating to consumer loan receivables sold through
securitization and other sale transactions, as well as gains and losses
recognized as a result of the securitization transactions, and fair value
adjustments to the interest-only strips. Servicing and securitizations income
increased $364.4 million, or 15%, to $2.8 billion for the year ended
December 31, 2002, from $2.4 billion in 2001. This increase was primarily
due to a 49% increase in the average off-balance sheet loan portfolio offset in
part by a reduction in the excess spread generated by the securitized loan
portfolio and a $33.1 million decrease in the fair value of interest-only strips.
Servicing and securitizations income increased $1.3 billion, or 112%, to $2.4
billion for the year ended December 31, 2001, from $1.2 billion in 2000.
This increase was primarily due to a 64% increase in the average off-balance
sheet loan portfolio and a shift in the mix of that portfolio towards higher
yielding, lower credit quality loans to more closely reflect the composition of
the managed portfolio.
Certain estimates inherent in the determination of the fair value of the
retained interests are influenced by factors outside the Company’s control,
and as a result, such estimates could materially change in the near term. Any
future gains that will be recognized in accordance with SFAS 140 will be
dependent on the timing and amount of future securitizations. The
Company intends to continuously assess the performance of new and existing
securitization transactions, and therefore the valuation of retained interests, as
estimates of future cash flows change.
Service Charges and Other Customer-Related Fees
Service charges and other customer-related fees increased by $401.4 million,
or 26%, to $1.9 billion for the year ended December 31, 2002. The increase
primarily reflects an increase in the reported loan portfolio of $7.0 billion or
33% over 2001 and a $44.4 million increase related to the one-time impact
of the 2002 change in the recoveries estimate (see “Change in Recoveries
Classification” above) offset by a shift in the mix of the reported loan
portfolio toward a greater composition of lower fee-generating loans.