Capital One 2002 Annual Report Download - page 38
Download and view the complete annual report
Please find page 38 of the 2002 Capital One annual report below. You can navigate through the pages in the report by either clicking on the pages listed below, or by using the keyword search tool below to find specific information within the annual report.-
 1
1 -
2
-
3
-
4
-
5
-
6
-
7
-
8
-
9
-
10
-
11
-
12
-
13
-
14
-
15
-
16
-
17
-
18
-
19
-
20
-
21
-
22
-
23
-
24
-
25
-
26
-
27
-
 28
28 -
 29
29 -
 30
30 -
 31
31 -
 32
32 -
 33
33 -
 34
34 -
 35
35 -
 36
36 -
 37
37 -
 38
38 -
 39
39 -
 40
40 -
 41
41 -
 42
42 -
 43
43 -
 44
44 -
 45
45 -
 46
46 -
 47
47 -
 48
48 -
49
-
50
-
51
-
52
-
53
-
54
-
55
-
56
-
57
-
58
-
59
-
60
-
61
-
62
-
63
-
64
-
65
-
66
-
67
-
68
-
69
-
70
-
71
-
72
-
73
-
74
-
75
-
76
-
77
-
78
-
79
-
80
-
81
 |
 |

36
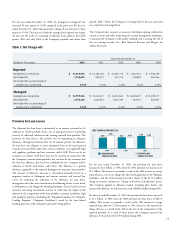
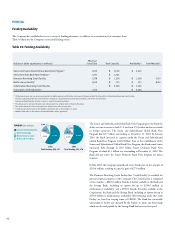
Funding Obligations
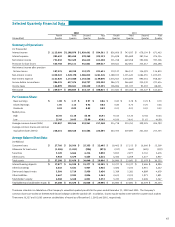
Table 13 summarizes the amounts and maturities of the contractual funding obligations of the Company, including off-balance sheet funding.
Table 13: Funding Obligations
As of December 31, 2002 Total Up to 1 year 1-3 years 4-5 years After 5 years
Interest-bearing deposits $ 17,325,965 $ 4,880,378 $ 6,682,686 $ 5,508,154 $ 254,747
Senior notes 5,565,615 1,059,917 2,562,107 1,544,194 399,397
Other borrowings 6,365,075 2,747,137 2,416,139 1,195,976 5,823
Operating leases 292,927 53,165 84,873 70,420 84,469
Off-balance sheet
securitization amortization 31,841,923 8,966,743 8,859,607 9,733,705 4,281,868
Total obligations $ 61,391,505 $ 17,707,340 $ 20,605,412 $ 18,052,449 $ 5,026,304
The terms of the lease and credit facility agreements related to certain other borrowings and operating leases in Table 13 require several financial covenants
(including performance measures and equity ratios) to be met. If these covenants are not met, there may be an acceleration of the payment due dates noted
above. As of December 31, 2002, the Company was not in default of any such covenants.
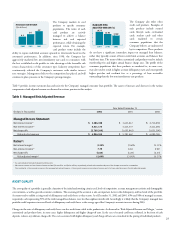
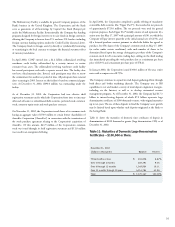
Table 12 reflects the costs of other borrowings of the Company as of and for each of the years ended December 31, 2002, 2001 and 2000.
Table 12: Short-Term Borrowings
Maximum
Outstanding Outstanding Average Average Year-End
(Dollars in Thousands) as of any Month-End as of Year-End Outstanding Interest Rate Interest Rate
2002:
Federal funds purchased and resale agreements $ 1,741,911 $ 554,887 $ 1,118,185 1.66% 1.26%
Other 1,418,184 897,208 844,715 2.96 2.09
Total $ 1,452,095 $ 1,962,900 2.22% 1.77%
2001:
Federal funds purchased and resale agreements $ 1,643,524 $ 434,024 $ 1,046,647 3.77% 1.91%
Other 616,584 449,393 224,995 7.66 2.29
Total $ 883,417 $ 1,271,642 4.46% 2.10%
2000:
Federal funds purchased and resale agreements $ 1,303,714 $ 1,010,693 $ 1,173,267 6.26% 6.58%
Other 371,020 43,359 129,700 11.52 6.17
Total $ 1,054,052 $ 1,302,967 6.79% 6.56%
Additional information regarding funding can be found in Note F to the Consolidated Financial Statements.