Capital One 2002 Annual Report Download - page 21
Download and view the complete annual report
Please find page 21 of the 2002 Capital One annual report below. You can navigate through the pages in the report by either clicking on the pages listed below, or by using the keyword search tool below to find specific information within the annual report.-
 1
1 -
2
-
3
-
4
-
5
-
6
-
7
-
8
-
9
-
10
-
 11
11 -
 12
12 -
 13
13 -
 14
14 -
 15
15 -
 16
16 -
 17
17 -
 18
18 -
 19
19 -
 20
20 -
 21
21 -
 22
22 -
 23
23 -
 24
24 -
 25
25 -
 26
26 -
 27
27 -
 28
28 -
 29
29 -
 30
30 -
 31
31 -
32
-
33
-
34
-
35
-
36
-
37
-
38
-
39
-
40
-
41
-
42
-
43
-
44
-
45
-
46
-
47
-
48
-
49
-
50
-
51
-
52
-
53
-
54
-
55
-
56
-
57
-
58
-
59
-
60
-
61
-
62
-
63
-
64
-
65
-
66
-
67
-
68
-
69
-
70
-
71
-
72
-
73
-
74
-
75
-
76
-
77
-
78
-
79
-
80
-
81
 |
 |
19
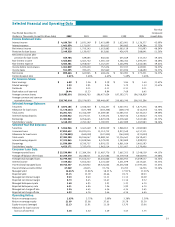
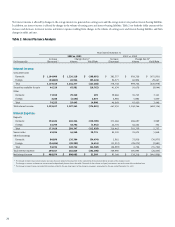
Selected Financial and Operating Data
Five Year
Year Ended December 31 Compound
(Dollars in Thousands, Except Per Share Data) 2002 2001 2000 1999 1998 Growth Rate
Income Statement Data:
Interest income $ 4,180,766 $ 2,921,149 $ 2,453,899 $ 1,623,001 $ 1,126,277 42.09%
Interest expense 1,461,654 1,171,007 801,017 540,882 424,284 33.72%
Net interest income 2,719,112 1,750,142 1,652,882 1,082,119 701,993 48.24%
Provision for loan losses 2,149,328 1,120,457 812,861 426,470 288,841 51.36%
Net interest income after
provision for loan losses 569,784 629,685 840,021 655,649 413,152 39.12%
Non-interest income 5,466,836 4,463,762 3,065,110 2,386,364 1,495,355 38.49%
Non-interest expense 4,585,581 4,058,027 3,147,657 2,464,996 1,464,586 39.21%
Income before income taxes 1,451,039 1,035,420 757,474 577,017 443,921 36.57%
Income taxes 551,395 393,455 287,840 213,926 168,690 36.57%
Net income $ 899,644 $ 641,965 $ 469,634 $ 363,091 $ 275,231 36.57%
Dividend payout ratio 2.61% 3.48% 4.43% 5.69% 7.46%
Per Common Share:
Basic earnings $ 4.09 $ 3.06 $ 2.39 $ 1.84 $ 1.40 33.63%
Diluted earnings 3.93 2.91 2.24 1.72 1.32 33.41%
Dividends 0.11 0.11 0.11 0.11 0.11
Book value as of year-end 20.44 15.33 9.94 7.69 6.45
Average common shares 219,983,691 209,866,782 196,477,624 197,593,371 196,768,929
Average common and common
equivalent shares 228,743,610 220,576,093 209,448,697 210,682,740 208,765,296
Selected Average Balances:
Securities $ 3,873,186 $ 3,038,360 $ 1,764,257 $ 2,027,051 $ 1,877,276 18.59%
Allowance for loan losses (1,178,243 ) (637,789) (402,208) (269,375) (214,333) 54.76%
Total assets 34,201,724 23,346,309 15,209,585 11,085,013 8,330,432 39.09%
Interest-bearing deposits 15,606,942 10,373,511 5,339,474 2,760,536 1,430,042 74.71%
Borrowings 11,381,062 8,056,665 6,870,038 6,078,480 5,261,588 20.71%
Stockholders’ equity 4,148,150 2,781,182 1,700,973 1,407,899 1,087,983 38.16%
Selected Year-End Balances:
Securities $ 5,064,946 $ 3,467,449 $ 1,859,029 $ 1,968,853 $ 2,080,980
Consumer loans 27,853,652 20,921,014 15,112,712 9,913,549 6,157,111
Allowance for loan losses (1,720,000 ) (840,000) (527,000) (342,000) (231,000)
Total assets 37,382,380 28,184,047 18,889,341 13,336,443 9,419,403
Interest-bearing deposits 17,325,965 12,838,968 8,379,025 3,783,809 1,999,979
Borrowings 11,930,690 9,330,757 6,976,535 6,961,014 5,481,593
Stockholders’ equity 4,623,171 3,323,478 1,962,514 1,515,607 1,270,406
Consumer Loan Data:
Average reported loans $ 25,539,996 $ 17,284,306 $ 11,487,776 $ 7,667,355 $ 5,348,559 44.15%
Average off-balance sheet loans 27,259,570 18,328,011 11,147,086 10,379,558 9,860,978 25.08%
Average total managed loans 52,799,566 35,612,317 22,634,862 18,046,913 15,209,537 32.34%
Interest income 7,729,462 5,654,363 4,131,420 3,231,979 2,615,441 30.33%
Year-end total managed loans 59,746,537 45,263,963 29,524,026 20,236,588 17,395,126 33.23%
Year-end total accounts (000s) 47,369 43,815 33,774 23,705 16,706 32.16%
Managed yield 14.64 % 15.88 % 18.25 % 17.91 % 17.20 %
Reported yield 15.15 15.79 20.46 19.72 19.03
Managed net interest margin 9.23 9.40 11.11 11.12 10.09
Reported net interest margin 8.73 8.45 12.47 11.16 9.72
Managed delinquency rate 5.60 4.95 5.23 5.23 4.70
Reported delinquency rate 6.51 4.84 7.26 5.92 4.70
Managed net charge-off rate 5.24 4.65 4.56 4.34 5.65
Reported net charge-off rate 4.93 4.76 5.46 4.16 4.64
Operating Ratios:
Return on average assets 2.63% 2.75% 3.09% 3.28% 3.30%
Return on average equity 21.69 23.08 27.61 25.79 25.30
Equity to assets (average) 12.13 11.91 11.18 12.70 13.06
Allowance for loan losses to
loans as of year-end 6.18 4.02 3.49 3.45 3.75