Capital One 2002 Annual Report Download - page 33
Download and view the complete annual report
Please find page 33 of the 2002 Capital One annual report below. You can navigate through the pages in the report by either clicking on the pages listed below, or by using the keyword search tool below to find specific information within the annual report.-
 1
1 -
2
-
3
-
4
-
5
-
6
-
7
-
8
-
9
-
10
-
11
-
12
-
13
-
14
-
15
-
16
-
17
-
18
-
19
-
20
-
21
-
22
-
 23
23 -
 24
24 -
 25
25 -
 26
26 -
 27
27 -
 28
28 -
 29
29 -
 30
30 -
 31
31 -
 32
32 -
 33
33 -
 34
34 -
 35
35 -
 36
36 -
 37
37 -
 38
38 -
 39
39 -
 40
40 -
 41
41 -
 42
42 -
 43
43 -
44
-
45
-
46
-
47
-
48
-
49
-
50
-
51
-
52
-
53
-
54
-
55
-
56
-
57
-
58
-
59
-
60
-
61
-
62
-
63
-
64
-
65
-
66
-
67
-
68
-
69
-
70
-
71
-
72
-
73
-
74
-
75
-
76
-
77
-
78
-
79
-
80
-
81
 |
 |

31
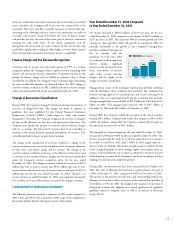
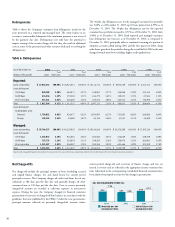
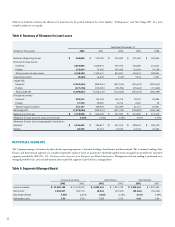
growth. Table 7 shows the Company’s net charge-offs for the years presented
on a reported and managed basis.
The Company takes measures as necessary, including requiring collateral on
certain accounts and other marketing and account management techniques,
to maintain the Company’s credit quality standards and to manage the risk of
loss on existing accounts. See “Risk Adjusted Revenue and Margin” for
further discussion.
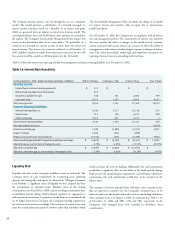
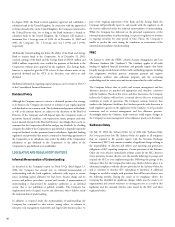
For the year ended December 31, 2002, the managed net charge-off rate
increased 59 basis points to 5.24% compared to the prior year. For the year
ended December 31, 2002, the reported net charge-off rate increased 17 basis
points to 4.93%. The increase in both the managed and reported net charge-
off rates was the result of a seasoning of subprime loans added in the fourth
quarter 2001 and early 2002 to the Company’s portfolio and slower loan
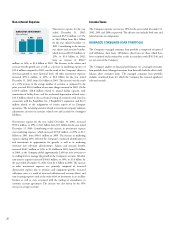
Provision For Loan Losses
The allowance for loan losses is maintained at an amount estimated to be
sufficient to absorb probable losses, net of principal recoveries (including
recovery of collateral), inherent in the existing reported loan portfolio. The
provision for loan losses is the periodic cost of maintaining an adequate
allowance. Management believes that, for all relevant periods, the allowance
for loan losses was adequate to cover anticipated losses in the total reported
consumer loan portfolio under then current conditions, met applicable legal
and regulatory guidance and was consistent with GAAP. There can be no
assurance as to future credit losses that may be incurred in connection with
the Company’s consumer loan portfolio, nor can there be any assurance that
the loan loss allowance that has been established by the Company will be
sufficient to absorb such future credit losses. The allowance is a general
allowance applicable to the reported homogeneous consumer loan portfolio.
The amount of allowance necessary is determined primarily based on a
migration analysis of delinquent and current accounts and forward loss
curves. In evaluating the sufficiency of the allowance for loan losses,
management also takes into consideration the following factors: recent trends
in delinquencies and charge-offs including bankrupt, deceased and recovered
amounts; forecasting uncertainties and size of credit risks; the degree of risk
inherent in the composition of the loan portfolio; economic conditions; legal
and regulatory guidance (including the “Expanded Guidance for Subprime
Lending Programs” (“Subprime Guidelines”) issued by the four federal
banking agencies); credit evaluations and underwriting policies.
For the year ended December 31, 2002, the provision for loan losses
increased to $2.1 billion, or 92%, from the 2001 provision for loan losses of
$1.1 billion. This increase is primarily a result of the 48% increase in average
reported loans, a rise in net charge-offs, the revised application of the Subprime
Guidelines, and the aforementioned one-time impact of the $133.4 million
change in recoveries estimate (see “Change in Recoveries Classification” above).
The Company applied its allowance models, including these factors, and
increased the allowance for loan losses by a total of $880.0 million during 2002.
For the year ended December 31, 2001, the provision for loan losses increased
to $1.1 billion, or 38%, from the 2000 provision for loan losses of $812.9
million. This increase is primarily a result of the 50% increase in average
reported loans, offset by a 70 basis point, or 13%, decrease in the reported net
charge-off rates as a result of the shift in the mix of the composition of the
reported portfolio. As a result of these factors, the Company increased the
allowance for loan losses by $313.0 million during 2001.
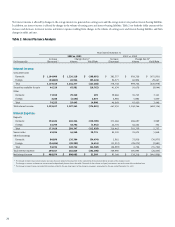
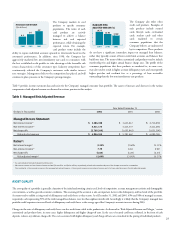
Table 7: Net Charge-offs
Year Ended December 31
(Dollars in Thousands) 2002 2001 2000 1999 1998
Reported:
Average loans outstanding $ 25,539,996 $ 17,284,306 $ 11,487,776 $ 7,667,355 $ 5,348,559
Net charge-offs 1,259,684 822,257 627,312 318,992 248,344
Net charge-offs as a percentage of
average loans outstanding 4.93% 4.76% 5.46% 4.16% 4.64%
Managed:
Average loans outstanding $ 52,799,566 $ 35,612,617 $ 22,634,862 $ 18,046,913 $ 15,209,537
Net charge-offs 2,769,249 1,655,947 1,031,590 782,537 858,955
Net charge-offs as a percentage of
average loans outstanding 5.24% 4.65% 4.56% 4.34% 5.65%
MANAGED NET
CHARGE-OFF RATE
2001
5.24
2002
4.93
4.65 4.76
2000
4.56
5.46
REPORTED NET
CHARGE-OFF RATE
NET CHARGE-OFF RATE (%)