Capital One 2002 Annual Report Download - page 25
Download and view the complete annual report
Please find page 25 of the 2002 Capital One annual report below. You can navigate through the pages in the report by either clicking on the pages listed below, or by using the keyword search tool below to find specific information within the annual report.-
 1
1 -
2
-
3
-
4
-
5
-
6
-
7
-
8
-
9
-
10
-
11
-
12
-
13
-
14
-
 15
15 -
 16
16 -
 17
17 -
 18
18 -
 19
19 -
 20
20 -
 21
21 -
 22
22 -
 23
23 -
 24
24 -
 25
25 -
 26
26 -
 27
27 -
 28
28 -
 29
29 -
 30
30 -
 31
31 -
 32
32 -
 33
33 -
 34
34 -
 35
35 -
36
-
37
-
38
-
39
-
40
-
41
-
42
-
43
-
44
-
45
-
46
-
47
-
48
-
49
-
50
-
51
-
52
-
53
-
54
-
55
-
56
-
57
-
58
-
59
-
60
-
61
-
62
-
63
-
64
-
65
-
66
-
67
-
68
-
69
-
70
-
71
-
72
-
73
-
74
-
75
-
76
-
77
-
78
-
79
-
80
-
81
 |
 |

23
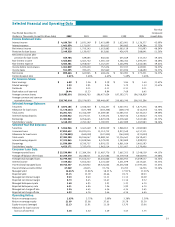
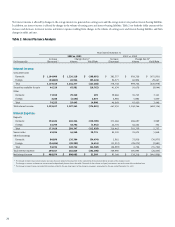
Year Ended December 31 2002 2001 2000
Average Income/ Yield/ Average Income/ Yield/ Average Income/ Yield/
(In Thousands) Balance Expense Rate Balance Expense Rate Balance Expense Rate
Assets:
Earning assets
Consumer loans(1)
Domestic $ 22,711,141 $ 3,506,732 15.44% $ 14,648,298 $ 2,342,726 15.99% $ 9,320,165 $ 2,060,349 22.11%
Foreign 2,828,855 361,932 12.79% 2,636,008 386,793 14.67% 2,167,611 290,422 13.40%
Total 25,539,996 3,868,664 15.15% 17,284,306 2,729,519 15.79% 11,487,776 2,350,771 20.46%
Securities available for sale 3,873,186 184,407 4.76% 2,526,529 138,188 5.47% 1,611,582 96,554 5.99%
Other
Domestic 1,488,861 116,890 7.85% 593,050 45,877 7.74% 107,416 5,993 5.58%
Foreign 245,556 10,805 4.40% 302,287 7,565 2.50% 45,259 581 1.28%
Total 1,734,417 127,695 7.36% 895,337 53,442 5.97% 152,675 6,574 4.31%
Total earning assets 31,147,599 $ 4,180,766 13.42% 20,706,172 $ 2,921,149 14.11% 13,252,033 $ 2,453,899 18.52%
Cash and due from banks 507,355 171,392 103,390
Allowance for loan losses (1,178,243) (637,789) (402,208)
Premises and equipment, net 802,544 735,282 549,133
Other 2,922,469 2,371,252 1,707,237
Total assets $ 34,201,724 $ 23,346,309 $ 15,209,585
Liabilities and Equity:
Interest-bearing liabilities
Deposits
Domestic $ 14,650,582 $ 748,809 5.11% $ 9,700,132 $ 594,183 6.13% $ 5,313,178 $ 322,497 6.07%
Foreign 956,360 63,080 6.60% 673,379 46,287 6.87% 26,296 1,511 5.75%
Total 15,606,942 811,889 5.20% 10,373,511 640,470 6.17% 5,339,474 324,008 6.07%
Senior notes 5,668,343 422,529 7.45% 5,064,356 357,495 7.06% 3,976,623 274,975 6.91%
Other borrowings
Domestic 5,689,369 226,206 3.98% 2,551,996 145,316 5.69% 2,011,295 142,355 7.08%
Foreign 23,350 1,030 4.41% 440,313 27,726 6.30% 882,120 59,679 6.77%
Total 5,712,719 227,236 3.98% 2,992,309 173,042 5.78% 2,893,415 202,034 6.98%
Total interest-bearing liabilities 26,988,004 $ 1,461,654 5.42% 18,430,176 $ 1,171,007 6.35% 12,209,512 $ 801,017 6.56%
Other 3,065,570 2,134,951 1,299,100
Total liabilities 30,053,574 20,565,127 13,508,612
Equity 4,148,150 2,781,182 1,700,973
Total liabilities and equity $ 34,201,724 $ 23,346,309 $ 15,209,585
Net interest spread 8.00% 7.76% 11.96%
Interest income to average earning assets 13.42% 14.11% 18.52%
Interest expense to average earning assets 4.69% 5.66% 6.05%
Net interest margin 8.73% 8.45% 12.47%
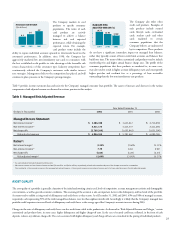
(1) Interest income includes past-due fees on loans of approximately $955.8 million, $769.5 million and $824.9 million for the years ended December 31, 2002, 2001 and 2000, respectively. Interest income includes
$38.4 million related to the one-time impact of the change in recoveries assumption for the year ended December 31, 2002. This resulted in a 12 basis point increase in the net interest margin.
Table 1 provides average balance sheet data, and an analysis of net interest income, net interest spread (the difference between the yield on earning assets and
the cost of interest-bearing liabilities) and net interest margin for each of the years ended December 31, 2002, 2001 and 2000.
Table 1: Statements of Average Balances, Income and Expense, Yields and Rates