Capital One 2002 Annual Report Download - page 40
Download and view the complete annual report
Please find page 40 of the 2002 Capital One annual report below. You can navigate through the pages in the report by either clicking on the pages listed below, or by using the keyword search tool below to find specific information within the annual report.-
 1
1 -
2
-
3
-
4
-
5
-
6
-
7
-
8
-
9
-
10
-
11
-
12
-
13
-
14
-
15
-
16
-
17
-
18
-
19
-
20
-
21
-
22
-
23
-
24
-
25
-
26
-
27
-
28
-
29
-
 30
30 -
 31
31 -
 32
32 -
 33
33 -
 34
34 -
 35
35 -
 36
36 -
 37
37 -
 38
38 -
 39
39 -
 40
40 -
 41
41 -
 42
42 -
 43
43 -
 44
44 -
 45
45 -
 46
46 -
 47
47 -
 48
48 -
 49
49 -
 50
50 -
51
-
52
-
53
-
54
-
55
-
56
-
57
-
58
-
59
-
60
-
61
-
62
-
63
-
64
-
65
-
66
-
67
-
68
-
69
-
70
-
71
-
72
-
73
-
74
-
75
-
76
-
77
-
78
-
79
-
80
-
81
 |
 |

would accelerate the need for funding. Additionally, this early amortization
would have a significant effect on the ability of the Bank and the Savings
Bank to meet the capital adequacy requirements as all off-balance sheet loans
experiencing such early amortization would have to be recorded on the
balance sheet.
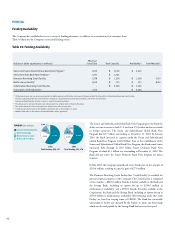
The amounts of investor principal from off-balance sheet consumer loans
that are expected to amortize into the Company’s consumer loans, or be
otherwise paid over the periods indicated, based on outstanding off-balance
sheet consumer loans as of January 1, 2003 are summarized in Table 13. As
of December 31, 2002 and 2001, 53% and 54%, respectively, of the
Company’s total managed loans were included in off-balance sheet
securitizations.
Liquidity Risk
Liquidity risk refers to the Company’s inability to meet its cash needs. The
Company meets its cash requirements by securitizing assets, gathering
deposits and issuing debt and equity. As discussed in “Managed Consumer
Loan Portfolio,” a significant source of liquidity for the Company has been
the securitization of consumer loans. Maturity terms of the existing
securitizations vary from 2003 to 2008, and for revolving securitizations have
accumulation periods during which principal payments are aggregated to
make payments to investors. As payments on the loans are accumulated and
are no longer reinvested in new loans, the Company’s funding requirements
for such new loans increase accordingly. The occurrence of certain events may
cause the securitization transactions to amortize earlier than scheduled, which
38
Table 14: Interest Rate Sensitivity
As of December 31, 2002 - Subject to Repricing (Dollars in Millions) Within 180 Days > 180 Days-1 Year >1 Year-5 Years Over 5 Years
Earning assets:
Federal funds sold and resale agreements $ 374 $ - $ - $ -
Interest-bearing deposits at other banks 267 - - -
Securities available for sale 548 561 2,606 709
Consumer loans 8,135 1,200 8,956 9,563
Total earning assets 9,324 1,761 11,562 10,272
Interest-bearing liabilities:
Interest-bearing deposits 3,180 2,773 11,118 255
Senior notes 714 326 4,127 399
Other borrowings 3,631 657 2,072 5
Total interest-bearing liabilities 7,525 3,756 17,317 659
Non-rate related net assets - - - (3,662)
Interest sensitivity gap 1,799 (1,995) (5,755) 5,951
Impact of swaps 1,060 (361) (699) -
Impact of consumer loan securitizations (4,758) (427) (2,789) 7,974
Interest sensitivity gap adjusted for impact of securitizations and swaps $ (1,899) $ (2,783) $ (9,243) $ 13,925
Adjusted gap as a percentage of managed assets - 2.78% - 4.08% - 13.53% 20.39%
Adjusted cumulative gap $ (1,899) $ (4,682) $ (13,925) $ -
Adjusted cumulative gap as a percentage of managed assets - 2.78% - 6.86% - 20.39% 0.00%
The Asset/Liability Management Policy also limits the change in 12-month
net interest income and economic value of equity, due to instantaneous
parallel rate shocks.
As of December 31, 2002, the Company was in compliance with all interest
rate risk management policies. The measurement of interest rate sensitivity
does not consider the effects of changes in the overall level of economic
activity associated with various interest rate scenarios or reflect the ability of
management to take action to further mitigate exposure to changes in interest
rates. This action may include, within legal and competitive constraints, the
repricing of interest rates on outstanding credit card loans.
The Company measures interest rate risk through the use of a simulation
model. The model generates a distribution of 12-month managed net
interest income outcomes based on a plausible set of interest rate paths,
which are generated from an industry-accepted term structure model. The
consolidated balance sheet and all off-balance sheet positions are included in
the analysis. The Company’s Asset/Liability Management Policy requires that
based on this distribution there be no more than a 5% probability of a
reduction in 12-month net interest income of more than 3% of base net
interest income. The interest rate scenarios evaluated as of December 31,
2002 included scenarios in which short-term interest rates rose by over 300
basis points or fell by as much as 140 basis points over the 12 months.
Table 14 reflects the interest rate repricing schedule for earning assets and interest-bearing liabilities as of December 31, 2002.