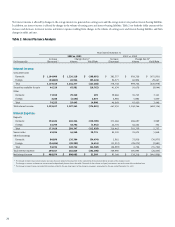
Capital One 2002 Annual Report Download - page 31
Download and view the complete annual report
Please find page 31 of the 2002 Capital One annual report below. You can navigate through the pages in the report by either clicking on the pages listed below, or by using the keyword search tool below to find specific information within the annual report.
29
The Company also offers other
credit card products. Examples of
such products include secured
cards, lifestyle cards, co-branded
cards, student cards and other
cards marketed to certain
consumer populations that the
Company believes are underserved
by its competitors. These products
do not have a significant, immediate impact on managed loan balances;
rather they typically consist of lower credit limit accounts and balances that
build over time. The terms of these customized card products tend to include
membership fees and higher annual finance charge rates. The profile of the
consumer populations that these products are marketed to, in some cases,
may also tend to result in higher account delinquency rates and consequently
higher past-due and overlimit fees as a percentage of loan receivables
outstanding than the low non-introductory rate products.
The Company markets its card
products to specific consumer
populations. The terms of each
card product are actively
managed to achieve a balance
between risk and expected
performance, while obtaining the
expected return. For example,
card product terms include the
ability to reprice individual accounts upwards or downwards based on the
consumer’s performance. In addition, since 1998, the Company has
aggressively marketed low non-introductory rate cards to consumers with
the best established credit profiles to take advantage of the favorable risk
return characteristics of this consumer type. Industry competitors have
continuously solicited the Company’s customers with similar interest
rate strategies. Management believes the competition has placed, and will
continue to place, pressure on the Company’s pricing strategies.
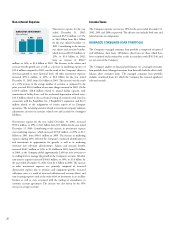
5.4
RISK ADJUSTED REVENUE
($ in billions)
6.9
200220012000
4.1
MANAGED RISK
ADJUSTED MARGIN (%)
12.09
20022001
13.95
2000
16.77
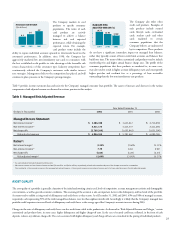
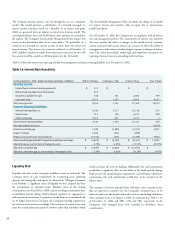
Table 5: Managed Risk Adjusted Revenue
Year Ended December 31
(Dollars in Thousands) 2002 2001 2000
Managed Income Statement:
Net interest income(2) $ 5,284,338 $ 3,633,817 $ 2,710,859
Non-interest income(2) 4,411,174 3,413,777 2,411,496
Net charge-offs (2,769,249) (1,655,947) (1,031,590)
Risk adjusted revenue $ 6,926,263 $ 5,391,647 $ 4,090,765
Ratios(1):
Net interest margin(2) 9.23% 9.40% 11.11%
Non-interest income(2) 7.70 8.83 9.89
Net charge-offs (4.84) (4.28) (4.23)
Risk adjusted margin(2) 12.09% 13.95% 16.77%
(1) As a percentage of average managed earning assets.
(2) Net interest income and non-interest income include $38.4 million and $44.4 million, respectively, related to the one-time impact of the change in recoveries assumption.
This resulted in a 7 basis point increase in the managed net interest margin, a 7 basis point increase in non-interest income and a 14 basis point increase in the risk adjusted margin.
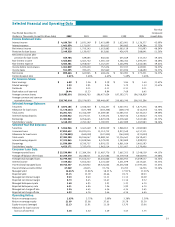
Table 5 provides income statement data and ratios for the Company’s managed consumer loan portfolio. The causes of increases and decreases in the various
components of risk adjusted revenue are discussed in sections previous to this analysis.
ASSET QUALITY
The asset quality of a portfolio is generally a function of the initial underwriting criteria used, levels of competition, account management activities and demographic
concentration, as well as general economic conditions. The seasoning of the accounts is also an important factor in the delinquency and loss levels of the portfolio.
Accounts tend to exhibit a rising trend of delinquency and credit losses as they season. As of December 31, 2002 and 2001, 45% and 58% of managed accounts,
respectively, each representing 51% of the total managed loan balance, were less than eighteen months old. Accordingly, it is likely that the Company’s managed loan
portfolio could experience increased levels of delinquency and credit losses as the average age of the Company’s accounts increases during 2003.
Changes in the rates of delinquency and credit losses can also result from a shift in the product mix. As discussed in “Risk Adjusted Revenue and Margin,” certain
customized card products have, in some cases, higher delinquency and higher charge-off rates. In the case of secured card loans, collateral, in the form of cash
deposits, reduces any ultimate charge-offs. The costs associated with higher delinquency and charge-off rates are considered in the pricing of individual products.


