Capital One 2002 Annual Report Download - page 59
Download and view the complete annual report
Please find page 59 of the 2002 Capital One annual report below. You can navigate through the pages in the report by either clicking on the pages listed below, or by using the keyword search tool below to find specific information within the annual report.-
 1
1 -
2
-
3
-
4
-
5
-
6
-
7
-
8
-
9
-
10
-
11
-
12
-
13
-
14
-
15
-
16
-
17
-
18
-
19
-
20
-
21
-
22
-
23
-
24
-
25
-
26
-
27
-
28
-
29
-
30
-
31
-
32
-
33
-
34
-
35
-
36
-
37
-
38
-
39
-
40
-
41
-
42
-
43
-
44
-
45
-
46
-
47
-
48
-
 49
49 -
 50
50 -
 51
51 -
 52
52 -
 53
53 -
 54
54 -
 55
55 -
 56
56 -
 57
57 -
 58
58 -
 59
59 -
 60
60 -
 61
61 -
 62
62 -
 63
63 -
 64
64 -
 65
65 -
 66
66 -
 67
67 -
 68
68 -
 69
69 -
70
-
71
-
72
-
73
-
74
-
75
-
76
-
77
-
78
-
79
-
80
-
81
 |
 |
57
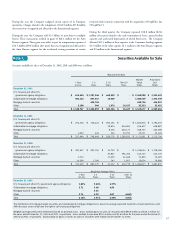
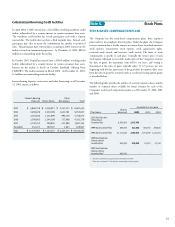
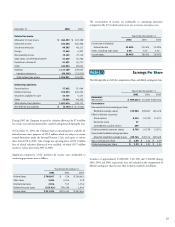
Note C Securities Available for Sale
Securities available for sale as of December 31, 2002, 2001 and 2000 were as follows:
Maturity Schedule
Market Amortized
1 Year 1-5 5-10 Over 10 Value Cost
or Less Years Years Years Totals Totals
December 31, 2002
U.S. Treasury and other U.S.
government agency obligations $ 613,404 $ 1,287,246 $ 669,339 $ - $ 2,569,989 $ 2,522,429
Collateralized mortgage obligations 492,163 897,547 10,929 - 1,400,639 1,373,759
Mortgage backed securities - 420,726 - - 420,726 414,822
Other 3,180 540 1,976 26,627 32,323 32,452
Total $ 1,108,747 $ 2,606,059 $ 682,244 $ 26,627 $ 4,423,677 $ 4,343,462
December 31, 2001
U.S. Treasury and other U.S.
government agency obligations $ 256,548 $ 748,224 $ 800,184 $ - $ 1,804,956 $ 1,796,033
Collateralized mortgage obligations - - 19,814 616,863 636,677 628,897
Mortgage backed securities - - 8,536 640,171 648,707 662,098
Other 1,092 424 244 23,791 25,551 25,678
Total $ 257,640 $ 748,648 $ 828,778 $ 1,280,825 $ 3,115,891 $ 3,112,706
December 31, 2000
U.S. Treasury and other U.S.
government agency obligations $ 283,607 $ 893,745 $ 10,702 $ - $ 1,188,054 $ 1,178,386
Collateralized mortgage obligations - - 20,867 391,240 412,107 414,770
Mortgage backed securities 3,752 - 11,420 61,648 76,820 74,695
Other 16,260 1,380 343 1,851 19,834 19,986
Total $ 303,619 $ 895,125 $ 43,332 $ 454,739 $ 1,696,815 $ 1,687,837
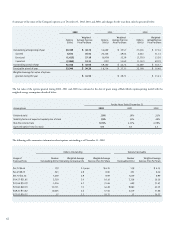
Weighted Average Yields
1 Year 1-5 5-10 Over 10
or Less Years Years Years
December 31, 2002
U.S. Treasury and other U.S. government agency obligations 2.82% 3.46% 4.37% -
Collateralized mortgage obligations 5.72 5.48 4.93 -
Mortgage backed securities - 5.65 --
Other 2.76 6.39 6.87 6.04%
Total 4.10% 4.51% 4.39% 6.04%
The distribution of mortgage-backed securities and collateralized mortgage obligations is based on average expected maturities. Actual maturities could
differ because issuers may have the right to call or prepay obligations.
Weighted average yields were determined based on amortized cost. Gross realized gains on sales of securities were $96.9 million and $19.1 million for
the years ended December 31, 2002 and 2001, respectively. Gross realized losses were $19.4 million and $5.6 million for the years ended December 31,
2002 and 2001, respectively. Substantially no gains or losses on sales of securities were realized for December 31, 2000.
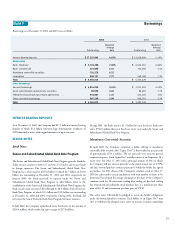
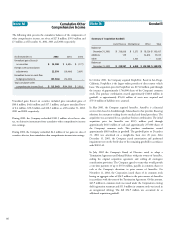
During the year, the Company realigned certain aspects of its European
operations. Charges related to the realignment of $12.5 million ($7.8 million
after taxes) were recognized and allocated to the International segment.
During the year, the Company sold $1.5 billion of auto loans to multiple
buyers. These transactions resulted in gains of $28.2 million for the Auto
Finance segment. These gains were offset in part by compensation expense of
$14.5 million ($9.0 million after taxes) that was recognized and allocated to
the Auto Finance segment for the accelerated vesting provisions of certain
restricted stock issued in connection with the acquisition of PeopleFirst, Inc.
(“PeopleFirst”).
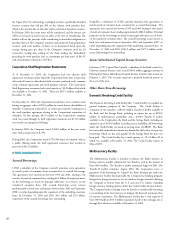
During the third quarter, the Company expensed $38.8 million ($24.1
million after taxes) related to the early termination of leases, unused facility
capacity, and accelerated depreciation of related fixed assets. The Company
allocated $35.3 million of these expenses to the Consumer Lending segment,
$1.5 million to the other caption, $1.1 million to the Auto Finance segment,
and $.9 million to the International segment.