Capital One 2002 Annual Report Download - page 53
Download and view the complete annual report
Please find page 53 of the 2002 Capital One annual report below. You can navigate through the pages in the report by either clicking on the pages listed below, or by using the keyword search tool below to find specific information within the annual report.-
 1
1 -
2
-
3
-
4
-
5
-
6
-
7
-
8
-
9
-
10
-
11
-
12
-
13
-
14
-
15
-
16
-
17
-
18
-
19
-
20
-
21
-
22
-
23
-
24
-
25
-
26
-
27
-
28
-
29
-
30
-
31
-
32
-
33
-
34
-
35
-
36
-
37
-
38
-
39
-
40
-
41
-
42
-
 43
43 -
 44
44 -
 45
45 -
 46
46 -
 47
47 -
 48
48 -
 49
49 -
 50
50 -
 51
51 -
 52
52 -
 53
53 -
 54
54 -
 55
55 -
 56
56 -
 57
57 -
 58
58 -
 59
59 -
 60
60 -
 61
61 -
 62
62 -
 63
63 -
64
-
65
-
66
-
67
-
68
-
69
-
70
-
71
-
72
-
73
-
74
-
75
-
76
-
77
-
78
-
79
-
80
-
81
 |
 |

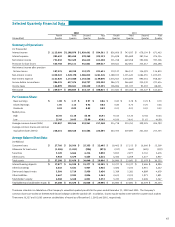
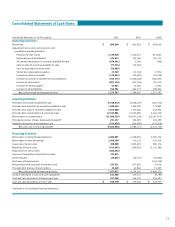
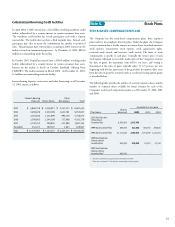
Consolidated Statements of Cash Flows
Year Ended December 31 (In Thousands) 2002 2001 2000
Operating Activities:
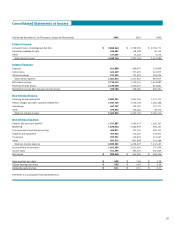
Net Income $ 899,644 $ 641,965 $ 469,634
Adjustments to reconcile net income to cash
provided by operating activities:
Provision for loan losses 2,149,328 1,120,457 812,861
Depreciation and amortization 374,613 332,264 245,171
(Accretion) amortization of securities available for sale (250,541) 5,298 (348)
Gain on sales of securities available for sale (77,515) (13,495) -
Gain on repurchase of senior notes (26,969) --
Stock plan compensation expense 27,749 (11,134) 17,976
Increase in interest receivable (112,053) (20,087) (18,038)
Increase in accounts receivable from securitizations (645,775) (1,266,268) (468,205)
Increase in other assets (857,116) (323,758) (16,513)
Increase in interest payable 47,921 55,060 6,253
Increase in other liabilities 746,501 864,573 489,001
Net cash provided by operating activities 2,275,787 1,384,875 1,537,792
Investing Activities:
Purchases of securities available for sale (5,748,073) (4,268,527) (407,572)
Proceeds from maturities of securities available for sale 1,589,449 1,481,390 172,889
Proceeds from sales of securities available for sale 3,255,488 1,370,466 432,203
Proceeds from securitizations of consumer loans 12,533,886 11,915,990 6,142,709
Net increase in consumer loans (21,008,535) (18,057,529) (12,145,055)
Principal recoveries of loans previously charged off 231,157 196,093 145,090
Additions of premises and equipment, net (275,436) (326,594) (374,018)
Net cash used in investing activities (9,422,064) (7,688,711) (6,033,754)
Financing Activities:
Net increase in interest-bearing deposits 4,486,997 4,459,943 4,595,216
Net increase in other borrowings 2,369,290 515,121 145,214
Issuances of senior notes 300,000 1,987,833 994,176
Maturities of senior notes (562,605) (706,916) (1,125,292)
Repurchases of senior notes (203,453) --
Issuance of mandatory convertible securities 725,075 --
Dividends paid (23,457) (22,310) (20,824)
Purchasesoftreasurystock - - (134,619)
Net proceeds from issuances of common stock 232,321 477,892 21,076
Proceeds from exercise of stock options 33,649 62,804 11,225
Net cash provided by financing activities 7,357,817 6,774,367 4,486,172
Increase (decrease) in cash and cash equivalents 211,540 470,531 (9,790)
Cash and cash equivalents at beginning of year 707,238 236,707 246,497
Cash and cash equivalents at end of year $ 918,778 $ 707,238 $ 236,707
See Notes to Consolidated Financial Statements.
51