Audi 2011 Annual Report Download - page 3
Download and view the complete annual report
Please find page 3 of the 2011 Audi annual report below. You can navigate through the pages in the report by either clicking on the pages listed below, or by using the keyword search tool below to find specific information within the annual report.-
 1
1 -
 2
2 -
 3
3 -
 4
4 -
 5
5 -
 6
6 -
 7
7 -
 8
8 -
 9
9 -
 10
10 -
 11
11 -
 12
12 -
 13
13 -
 14
14 -
15
-
16
-
17
-
18
-
19
-
20
-
21
-
22
-
23
-
24
-
25
-
26
-
27
-
28
-
29
-
30
-
31
-
32
-
33
-
34
-
35
-
36
-
37
-
38
-
39
-
40
-
41
-
42
-
43
-
44
-
45
-
46
-
47
-
48
-
49
-
50
-
51
-
52
-
53
-
54
-
55
-
56
-
57
-
58
-
59
-
60
-
61
-
62
-
63
-
64
-
65
-
66
-
67
-
68
-
69
-
70
-
71
-
72
-
73
-
74
-
75
-
76
-
77
-
78
-
79
-
80
-
81
-
82
-
83
-
84
-
85
-
86
-
87
-
88
-
89
-
90
-
91
-
92
-
93
-
94
-
95
-
96
-
97
-
98
-
99
-
100
-
101
-
102
-
103
-
104
-
105
-
106
-
107
-
108
-
109
-
110
-
111
-
112
-
113
-
114
-
115
-
116
-
117
-
118
-
119
-
120
-
121
-
122
-
123
-
124
-
125
-
126
-
127
-
128
-
129
-
130
-
131
-
132
-
133
-
134
-
135
-
136
-
137
-
138
-
139
-
140
-
141
-
142
-
143
-
144
-
145
-
146
-
147
-
148
-
149
-
150
-
151
-
152
-
153
-
154
-
155
-
156
-
157
-
158
-
159
-
160
-
161
-
162
-
163
-
164
-
165
-
166
-
167
-
168
-
169
-
170
-
171
-
172
-
173
-
174
-
175
-
176
-
177
-
178
-
179
-
180
-
181
-
182
-
183
-
184
-
185
-
186
-
187
-
188
-
189
-
190
-
191
-
192
-
193
-
194
-
195
-
196
-
197
-
198
-
199
-
200
-
201
-
202
-
203
-
204
-
205
-
206
-
207
-
208
-
209
-
210
-
211
-
212
-
213
-
214
-
215
-
216
-
217
-
218
-
219
-
220
-
221
-
222
-
223
-
224
-
225
-
226
-
227
-
228
-
229
-
230
-
231
-
232
-
233
-
234
-
235
-
236
-
237
-
238
-
239
-
240
-
241
-
242
-
243
-
244
-
245
-
246
-
247
-
248
-
249
-
250
-
251
-
252
-
253
-
254
-
255
-
256
-
257
-
258
-
259
-
260
-
261
-
262
-
263
-
264
-
265
-
266
-
267
-
268
-
269
-
270
-
271
 |
 |

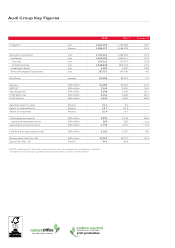
Audi Group Key Figures
2011 2010 Change in %
Production Cars 1,365,499 1,150,018 18.7
Engines 1,884,157 1,648,193 14.3
Deliveries to customers Cars 1,512,014 1,293,453 16.9
Audi brand Cars 1,302,659 1,092,411 19.2
Germany Cars 254,011 229,157 10.8
Outside Germany Cars 1,048,648 863,254 21.5
Lamborghini brand Cars 1,602 1,302 23.0
Other Volkswagen Group brands Cars 207,753 199,740 4.0
Workforce Average 62,806 59,513 5.5
Revenue EUR million 44,096 35,441 24.4
EBITDA 1) EUR million 7,1 41 5,452 31.0
Operating profi tEUR million5,348 3,340 60.1
Profi t before tax EUR million 6,041 3,634 66.2
Profi t after tax EUR million 4,440 2,630 68.8
Operating return on sales Percent 12.1 9.4
Return on sales before tax Percent 13.7 10.3
Return on investment Percent 35.4 24.7
Total capital investments EUR million 2,970 2,146 38.4
Capitalized development costs EUR million 596 630 – – 5.4
Depreciation and amortization EUR million 1,793 2,170 – – 17.4
Cash fl ow from operating activities EUR million 6,295 5,797 8.6
Balance sheet total (Dec. 31) EUR million 37,019 30,772 20.3
Equity ratio (Dec. 31) Percent 34.9 36.8
1)
EBITDA = operating profi t + balance from impairment losses (reversals) on property, plant and equipment, capitalized
development costs, leased assets, goodwill and long-term investments as per the Cash Flow Statement
carbon neutral
natureOffice.com | DE-250-349607
print production