Audi 2011 Annual Report Download - page 247
Download and view the complete annual report
Please find page 247 of the 2011 Audi annual report below. You can navigate through the pages in the report by either clicking on the pages listed below, or by using the keyword search tool below to find specific information within the annual report.-
 1
1 -
2
-
3
-
4
-
5
-
6
-
7
-
8
-
9
-
10
-
11
-
12
-
13
-
14
-
15
-
16
-
17
-
18
-
19
-
20
-
21
-
22
-
23
-
24
-
25
-
26
-
27
-
28
-
29
-
30
-
31
-
32
-
33
-
34
-
35
-
36
-
37
-
38
-
39
-
40
-
41
-
42
-
43
-
44
-
45
-
46
-
47
-
48
-
49
-
50
-
51
-
52
-
53
-
54
-
55
-
56
-
57
-
58
-
59
-
60
-
61
-
62
-
63
-
64
-
65
-
66
-
67
-
68
-
69
-
70
-
71
-
72
-
73
-
74
-
75
-
76
-
77
-
78
-
79
-
80
-
81
-
82
-
83
-
84
-
85
-
86
-
87
-
88
-
89
-
90
-
91
-
92
-
93
-
94
-
95
-
96
-
97
-
98
-
99
-
100
-
101
-
102
-
103
-
104
-
105
-
106
-
107
-
108
-
109
-
110
-
111
-
112
-
113
-
114
-
115
-
116
-
117
-
118
-
119
-
120
-
121
-
122
-
123
-
124
-
125
-
126
-
127
-
128
-
129
-
130
-
131
-
132
-
133
-
134
-
135
-
136
-
137
-
138
-
139
-
140
-
141
-
142
-
143
-
144
-
145
-
146
-
147
-
148
-
149
-
150
-
151
-
152
-
153
-
154
-
155
-
156
-
157
-
158
-
159
-
160
-
161
-
162
-
163
-
164
-
165
-
166
-
167
-
168
-
169
-
170
-
171
-
172
-
173
-
174
-
175
-
176
-
177
-
178
-
179
-
180
-
181
-
182
-
183
-
184
-
185
-
186
-
187
-
188
-
189
-
190
-
191
-
192
-
193
-
194
-
195
-
196
-
197
-
198
-
199
-
200
-
201
-
202
-
203
-
204
-
205
-
206
-
207
-
208
-
209
-
210
-
211
-
212
-
213
-
214
-
215
-
216
-
217
-
218
-
219
-
220
-
221
-
222
-
223
-
224
-
225
-
226
-
227
-
228
-
229
-
230
-
231
-
232
-
233
-
234
-
235
-
236
-
 237
237 -
 238
238 -
 239
239 -
 240
240 -
 241
241 -
 242
242 -
 243
243 -
 244
244 -
 245
245 -
 246
246 -
 247
247 -
 248
248 -
 249
249 -
 250
250 -
 251
251 -
 252
252 -
 253
253 -
 254
254 -
 255
255 -
 256
256 -
 257
257 -
258
-
259
-
260
-
261
-
262
-
263
-
264
-
265
-
266
-
267
-
268
-
269
-
270
-
271
 |
 |

244
AUDI AG and its Group companies primarily deposit their cash funds with the Volkswagen Group
or take up cash funds from the Volkswagen Group. All transactions are processed under market
conditions.
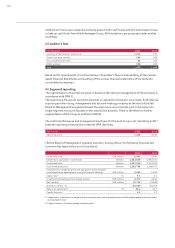
45 Auditor’s fees
EUR thousand 2011 2010
Auditing of the financial statements 1,015 732
Other assurance services 243 169
Tax consultancy services 84 87
Other services 108 103
Total 1,450 1,091
Based on the requirements of commercial law, the auditor’s fees include auditing of the Consoli-
dated Financial Statements and auditing of the annual financial statements of the domestic
consolidated companies.
46 Segment reporting
The segmentation of business activities is based on the internal management of the Company in
accordance with IFRS 8.
The Audi Group focuses its economic activities on automotive business. As a result, both internal
reporting and the voting, management and decision-making processes at the level of the full
Board of Management are geared toward the Audi Group as a corporate unit in the sense of a
single-segment structure focused on the automotive business. There is therefore no further
segmentation of the Group as defined in IFRS 8.
The central performance and management key figure for the Audi Group is its “operating profit.”
Internal reporting corresponds to external IFRS reporting.
EUR million 2011 2010
Operating profit 5,348 3,340
The full Board of Management regularly monitors, among others, the following financial and
economic key figures (also on a Group basis):
2011 2010
Profit before tax EUR million 6,041 3,634
Deliveries to customers – Audi brand Vehicles 1,302,659 1,092,411
Audi brand sales Vehicles 1,327,544 1,124,295
Audi brand production Vehicles 1,363,788 1,148,791
Investments in property, plant and equipment and intangible
assets (excluding development work and financial leasing) EUR million 2,266 1,449
Capex ratio 1) % 5.1 4.1
Inventories (including current leased assets) EUR million 4,377 3,354
Net liquidity EUR million 15,716 13,383
Workforce at Dec. 31 63,839 60,395
Return on investment % 35.4 24.7
Capital turnover 2) 4.2 3.7
1) Capex ratio = Investments in property, plant and equipment and intangible assets (excluding development work and finan-
cial leasing)/revenue
2) Capital turnover = Turnover/average invested assets