Audi 2011 Annual Report Download - page 227
Download and view the complete annual report
Please find page 227 of the 2011 Audi annual report below. You can navigate through the pages in the report by either clicking on the pages listed below, or by using the keyword search tool below to find specific information within the annual report.-
 1
1 -
2
-
3
-
4
-
5
-
6
-
7
-
8
-
9
-
10
-
11
-
12
-
13
-
14
-
15
-
16
-
17
-
18
-
19
-
20
-
21
-
22
-
23
-
24
-
25
-
26
-
27
-
28
-
29
-
30
-
31
-
32
-
33
-
34
-
35
-
36
-
37
-
38
-
39
-
40
-
41
-
42
-
43
-
44
-
45
-
46
-
47
-
48
-
49
-
50
-
51
-
52
-
53
-
54
-
55
-
56
-
57
-
58
-
59
-
60
-
61
-
62
-
63
-
64
-
65
-
66
-
67
-
68
-
69
-
70
-
71
-
72
-
73
-
74
-
75
-
76
-
77
-
78
-
79
-
80
-
81
-
82
-
83
-
84
-
85
-
86
-
87
-
88
-
89
-
90
-
91
-
92
-
93
-
94
-
95
-
96
-
97
-
98
-
99
-
100
-
101
-
102
-
103
-
104
-
105
-
106
-
107
-
108
-
109
-
110
-
111
-
112
-
113
-
114
-
115
-
116
-
117
-
118
-
119
-
120
-
121
-
122
-
123
-
124
-
125
-
126
-
127
-
128
-
129
-
130
-
131
-
132
-
133
-
134
-
135
-
136
-
137
-
138
-
139
-
140
-
141
-
142
-
143
-
144
-
145
-
146
-
147
-
148
-
149
-
150
-
151
-
152
-
153
-
154
-
155
-
156
-
157
-
158
-
159
-
160
-
161
-
162
-
163
-
164
-
165
-
166
-
167
-
168
-
169
-
170
-
171
-
172
-
173
-
174
-
175
-
176
-
177
-
178
-
179
-
180
-
181
-
182
-
183
-
184
-
185
-
186
-
187
-
188
-
189
-
190
-
191
-
192
-
193
-
194
-
195
-
196
-
197
-
198
-
199
-
200
-
201
-
202
-
203
-
204
-
205
-
206
-
207
-
208
-
209
-
210
-
211
-
212
-
213
-
214
-
215
-
216
-
 217
217 -
 218
218 -
 219
219 -
 220
220 -
 221
221 -
 222
222 -
 223
223 -
 224
224 -
 225
225 -
 226
226 -
 227
227 -
 228
228 -
 229
229 -
 230
230 -
 231
231 -
 232
232 -
 233
233 -
 234
234 -
 235
235 -
 236
236 -
 237
237 -
238
-
239
-
240
-
241
-
242
-
243
-
244
-
245
-
246
-
247
-
248
-
249
-
250
-
251
-
252
-
253
-
254
-
255
-
256
-
257
-
258
-
259
-
260
-
261
-
262
-
263
-
264
-
265
-
266
-
267
-
268
-
269
-
270
-
271
 |
 |

224
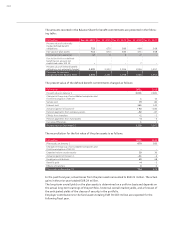
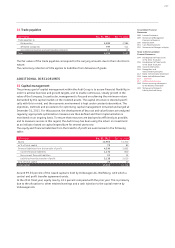
The amounts recorded in the Balance Sheet for benefit commitments are presented in the follow-
ing table:
EUR million Dec. 31, 2011 Dec. 31, 2010 Dec. 31, 2009 Dec. 31, 2008 Dec. 31, 2007
Present value of externally
funded defined benefit
obligations 723 679 586 464 368
Fair value of plan assets 714 670 583 471 368
Financing status (balance) 10 93 – 7 –
Due to the limit on a defined
benefit asset amount not
capitalized under IAS 19 ––– 7 –
Present value of defined benefit
obligations not externally funded 2,495 2,322 2,096 1,946 1,957
Provisions for pensions
recognized in the Balance Sheet 2,505 2,331 2,098 1,946 1,957
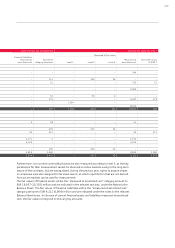
The present value of the defined benefit commitments changed as follows:
EUR million 2011 2010
Present value on January 1 3,001 2,681
Changes in the group of consolidated companies and
first-time adoption of IAS 19 1 12
Service cost 79 80
Interest cost 141 142
Actuarial gains (–)/losses (+) + 92 + 180
Pension payments from company assets – 92 – 87
Effects from transfers – 1 – 2
Pension payments from fund assets – 4 – 5
Currency differences 1 1
Present value on December 31 3,218 3,001
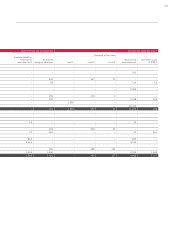
The reconciliation for the fair value of the plan assets is as follows:
EUR million 2011 2010
Plan assets on January 1 670 583
Changes in the group of consolidated companies and
first-time adoption of IAS 19 – –
Expected return on plan assets 29 30
Actuarial gains (+)/losses (–) – 51 – 6
Employer contributions 69 68
Benefits paid – 4 – 5
Effects of transfers 0 0
Plan assets on December 31 714 670
In the past fiscal year, actual losses from the plan assets amounted to EUR 21 million. The actual
gains in the prior year totaled EUR 24 million.
The long-term overall yield on the plan assets is determined on a uniform basis and depends on
the actual long-term earnings of the portfolio, historical overall market yields, and a forecast of
the anticipated yields of the classes of security in the portfolio.
Employer contributions to the fund assets totaling EUR 70 (67) million are expected for the
following fiscal year.