Audi 2011 Annual Report Download - page 199
Download and view the complete annual report
Please find page 199 of the 2011 Audi annual report below. You can navigate through the pages in the report by either clicking on the pages listed below, or by using the keyword search tool below to find specific information within the annual report.-
 1
1 -
2
-
3
-
4
-
5
-
6
-
7
-
8
-
9
-
10
-
11
-
12
-
13
-
14
-
15
-
16
-
17
-
18
-
19
-
20
-
21
-
22
-
23
-
24
-
25
-
26
-
27
-
28
-
29
-
30
-
31
-
32
-
33
-
34
-
35
-
36
-
37
-
38
-
39
-
40
-
41
-
42
-
43
-
44
-
45
-
46
-
47
-
48
-
49
-
50
-
51
-
52
-
53
-
54
-
55
-
56
-
57
-
58
-
59
-
60
-
61
-
62
-
63
-
64
-
65
-
66
-
67
-
68
-
69
-
70
-
71
-
72
-
73
-
74
-
75
-
76
-
77
-
78
-
79
-
80
-
81
-
82
-
83
-
84
-
85
-
86
-
87
-
88
-
89
-
90
-
91
-
92
-
93
-
94
-
95
-
96
-
97
-
98
-
99
-
100
-
101
-
102
-
103
-
104
-
105
-
106
-
107
-
108
-
109
-
110
-
111
-
112
-
113
-
114
-
115
-
116
-
117
-
118
-
119
-
120
-
121
-
122
-
123
-
124
-
125
-
126
-
127
-
128
-
129
-
130
-
131
-
132
-
133
-
134
-
135
-
136
-
137
-
138
-
139
-
140
-
141
-
142
-
143
-
144
-
145
-
146
-
147
-
148
-
149
-
150
-
151
-
152
-
153
-
154
-
155
-
156
-
157
-
158
-
159
-
160
-
161
-
162
-
163
-
164
-
165
-
166
-
167
-
168
-
169
-
170
-
171
-
172
-
173
-
174
-
175
-
176
-
177
-
178
-
179
-
180
-
181
-
182
-
183
-
184
-
185
-
186
-
187
-
188
-
 189
189 -
 190
190 -
 191
191 -
 192
192 -
 193
193 -
 194
194 -
 195
195 -
 196
196 -
 197
197 -
 198
198 -
 199
199 -
 200
200 -
 201
201 -
 202
202 -
 203
203 -
 204
204 -
 205
205 -
 206
206 -
 207
207 -
 208
208 -
 209
209 -
210
-
211
-
212
-
213
-
214
-
215
-
216
-
217
-
218
-
219
-
220
-
221
-
222
-
223
-
224
-
225
-
226
-
227
-
228
-
229
-
230
-
231
-
232
-
233
-
234
-
235
-
236
-
237
-
238
-
239
-
240
-
241
-
242
-
243
-
244
-
245
-
246
-
247
-
248
-
249
-
250
-
251
-
252
-
253
-
254
-
255
-
256
-
257
-
258
-
259
-
260
-
261
-
262
-
263
-
264
-
265
-
266
-
267
-
268
-
269
-
270
-
271
 |
 |

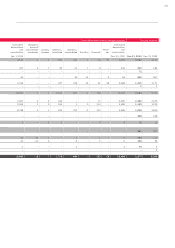
196
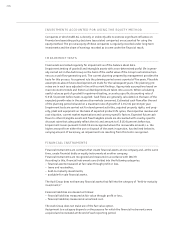
DEVELOPMENT OF FIXED ASSETS IN THE 2010 FISCAL YEAR
EUR million Gross carrying amounts
Costs
Changes in
group of
consolidated
companies
Currency
changes Additions
Changes from
measurement
at equity Transfers Disposals Costs
Jan. 1, 2010 Dec. 31, 2010
Intangible assets 4,684 150 1717 – 7 26 5,532
Concessions, industrial property rights
and similar rights and assets, as well as
licenses thereto 509 78 187 – 7 6676
Goodwill –72 – – – – –72
Capitalized development costs, products
currently under development 866 – – 502 – – 468 –900
Capitalized development costs, products
currently in use 3,307 – – 128 – 468 21 3,883
Payments on account for intangible assets 1 0 – 0 – 0 – 1
Property, plant and equipment 20,145 100 20 1,362 – – 7 534 21,085
Land, land rights and buildings, including
buildings on land owned by others, and
leased land and buildings 4,121 55 17 156 – 62 16 4,396
Plant and machinery 4,789 13 0127 – 137 219 4,848
Other plant and office equipment, as well as
leased plant and office equipment 10,616 28 2686 – 298 285 11,345
Payments on account and assets under
construction 618 3 0 393 – – 503 15 496
Investment property 17 – 2 – – – 019
Investments accounted for using the
equity method 212 –24 –91 – –326
Other long-term investments 140 – 22 267 – – 4183
Investments in affiliated companies 126 – 24 2 4 – – 1106
Shares in associated companies and
participating interests 11 2 – 63 – – –76
Securities 2 – – – – – 2 –
Total fixed assets 25,197 227 49 2,146 91 – 564 27,145