Audi 2011 Annual Report Download - page 240
Download and view the complete annual report
Please find page 240 of the 2011 Audi annual report below. You can navigate through the pages in the report by either clicking on the pages listed below, or by using the keyword search tool below to find specific information within the annual report.-
 1
1 -
2
-
3
-
4
-
5
-
6
-
7
-
8
-
9
-
10
-
11
-
12
-
13
-
14
-
15
-
16
-
17
-
18
-
19
-
20
-
21
-
22
-
23
-
24
-
25
-
26
-
27
-
28
-
29
-
30
-
31
-
32
-
33
-
34
-
35
-
36
-
37
-
38
-
39
-
40
-
41
-
42
-
43
-
44
-
45
-
46
-
47
-
48
-
49
-
50
-
51
-
52
-
53
-
54
-
55
-
56
-
57
-
58
-
59
-
60
-
61
-
62
-
63
-
64
-
65
-
66
-
67
-
68
-
69
-
70
-
71
-
72
-
73
-
74
-
75
-
76
-
77
-
78
-
79
-
80
-
81
-
82
-
83
-
84
-
85
-
86
-
87
-
88
-
89
-
90
-
91
-
92
-
93
-
94
-
95
-
96
-
97
-
98
-
99
-
100
-
101
-
102
-
103
-
104
-
105
-
106
-
107
-
108
-
109
-
110
-
111
-
112
-
113
-
114
-
115
-
116
-
117
-
118
-
119
-
120
-
121
-
122
-
123
-
124
-
125
-
126
-
127
-
128
-
129
-
130
-
131
-
132
-
133
-
134
-
135
-
136
-
137
-
138
-
139
-
140
-
141
-
142
-
143
-
144
-
145
-
146
-
147
-
148
-
149
-
150
-
151
-
152
-
153
-
154
-
155
-
156
-
157
-
158
-
159
-
160
-
161
-
162
-
163
-
164
-
165
-
166
-
167
-
168
-
169
-
170
-
171
-
172
-
173
-
174
-
175
-
176
-
177
-
178
-
179
-
180
-
181
-
182
-
183
-
184
-
185
-
186
-
187
-
188
-
189
-
190
-
191
-
192
-
193
-
194
-
195
-
196
-
197
-
198
-
199
-
200
-
201
-
202
-
203
-
204
-
205
-
206
-
207
-
208
-
209
-
210
-
211
-
212
-
213
-
214
-
215
-
216
-
217
-
218
-
219
-
220
-
221
-
222
-
223
-
224
-
225
-
226
-
227
-
228
-
229
-
 230
230 -
 231
231 -
 232
232 -
 233
233 -
 234
234 -
 235
235 -
 236
236 -
 237
237 -
 238
238 -
 239
239 -
 240
240 -
 241
241 -
 242
242 -
 243
243 -
 244
244 -
 245
245 -
 246
246 -
 247
247 -
 248
248 -
 249
249 -
 250
250 -
251
-
252
-
253
-
254
-
255
-
256
-
257
-
258
-
259
-
260
-
261
-
262
-
263
-
264
-
265
-
266
-
267
-
268
-
269
-
270
-
271
 |
 |

237
Consolidated Financial
Statements
188 Income Statement
189 Statement of Recognized
Income and Expense
190 Balance Sheet
191 Cash Flow Statement
192 Statement of Changes in Equity
Notes to the Consolidated
Financial Statements
194 Development of fixed assets
in the 2011 fiscal year
196 Development of fixed assets
in the 2010 fiscal year
198 General information
204 Recognition and
measurement principles
212 Notes to the Income Statement
218 Notes to the Balance Sheet
227 Additional disclosures
248 Events occurring subsequent
to the balance sheet date
249 Statement of Interests
held by the Audi Group
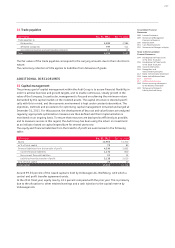
Fund price risks are measured within the Audi Group in accordance with IFRS 7 using sensitivity
analyses. Hypothetical changes to risk variables on the balance sheet date are examined to cal-
culate their impact on the prices of the financial instruments in the funds. Market prices and
indices are particularly relevant risk variables in the case of fund price risks.
Commodity price risks
Commodities are subject to the risk of fluctuating prices given the volatile nature of the com-
modity markets. Commodity futures are used to limit these risks. The hedging measures are
coordinated regularly between AUDI AG and Volkswagen AG, Wolfsburg, in accordance with the
existing Volkswagen organizational guideline. The hedging transactions are performed centrally
for AUDI AG by Volkswagen AG on the basis of an agency agreement. The results from hedging
contracts are credited or debited to the Audi Group on a monthly basis.
Hedging measures relate principally to significant quantities of the commodities aluminum and
copper. Contracts are concluded exclusively with first-rate national and international banks whose
creditworthiness is regularly examined by leading rating agencies and Central Risk Management
at Volkswagen AG.
Commodity price risks are also calculated using sensitivity analyses. Hypothetical changes in listed
prices are used to quantify the impact of changes in value of the hedging transactions on equity
and on profit after tax.
Interest rate risks
Interest rate risks stem from changes in market rates, above all for medium and long-term
variable-rate assets and liabilities.
The Audi Group limits interest rate risks, particularly with regard to the granting of loans and
credit, by agreeing fixed interest rates and also through interest rate swaps.
The risks associated with changing interest rates are presented in accordance with IFRS 7 using
sensitivity analyses. These involve presenting the effects of hypothetical changes in market
interest rates at the balance sheet date on interest payments, interest income and expenses,
and, where applicable, equity and profit after tax.
Residual value risks
Residual value risks arise from hedging arrangements with the retail trade or partner companies
according to which, in the context of buy-back obligations resulting from concluded lease agree-
ments, effects on profit caused by market-related fluctuations in residual values are partly borne
by the Audi Group.
The hedging arrangements are based on residual value recommendations, as adopted by the
residual value committee at the time of the contract being concluded, and then on current dealer
purchase values on the market at the time of the residual value hedging being settled. The residual
value recommendations are based on the forecasts provided by various independent institutions
using transaction prices.
Residual value risks are also calculated using sensitivity analyses. Hypothetical changes in the
market prices of used cars at the balance sheet date are used to quantify the impact on profit
after tax.
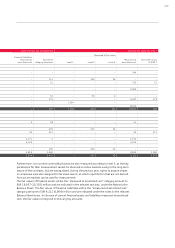
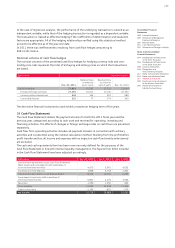
Quantifying currency risks by means of sensitivity analyses
If the functional currencies had in each case increased or decreased in value by 10 percent com-
pared with the other currencies as of the balance sheet date, the following major effects on the
hedging provision in equity and on profit would have resulted. From the 2011 fiscal year on-
ward, the effect of currency changes is reported after taxes. The previous year’s figures have been
adjusted accordingly for the purposes of comparison. Adding up the individual figures is not an
appropriate approach, as the results for each functional currency are based on differing scenarios.