Audi 2011 Annual Report Download - page 147
Download and view the complete annual report
Please find page 147 of the 2011 Audi annual report below. You can navigate through the pages in the report by either clicking on the pages listed below, or by using the keyword search tool below to find specific information within the annual report.-
 1
1 -
2
-
3
-
4
-
5
-
6
-
7
-
8
-
9
-
10
-
11
-
12
-
13
-
14
-
15
-
16
-
17
-
18
-
19
-
20
-
21
-
22
-
23
-
24
-
25
-
26
-
27
-
28
-
29
-
30
-
31
-
32
-
33
-
34
-
35
-
36
-
37
-
38
-
39
-
40
-
41
-
42
-
43
-
44
-
45
-
46
-
47
-
48
-
49
-
50
-
51
-
52
-
53
-
54
-
55
-
56
-
57
-
58
-
59
-
60
-
61
-
62
-
63
-
64
-
65
-
66
-
67
-
68
-
69
-
70
-
71
-
72
-
73
-
74
-
75
-
76
-
77
-
78
-
79
-
80
-
81
-
82
-
83
-
84
-
85
-
86
-
87
-
88
-
89
-
90
-
91
-
92
-
93
-
94
-
95
-
96
-
97
-
98
-
99
-
100
-
101
-
102
-
103
-
104
-
105
-
106
-
107
-
108
-
109
-
110
-
111
-
112
-
113
-
114
-
115
-
116
-
117
-
118
-
119
-
120
-
121
-
122
-
123
-
124
-
125
-
126
-
127
-
128
-
129
-
130
-
131
-
132
-
133
-
134
-
135
-
136
-
 137
137 -
 138
138 -
 139
139 -
 140
140 -
 141
141 -
 142
142 -
 143
143 -
 144
144 -
 145
145 -
 146
146 -
 147
147 -
 148
148 -
 149
149 -
 150
150 -
 151
151 -
 152
152 -
 153
153 -
 154
154 -
 155
155 -
 156
156 -
 157
157 -
158
-
159
-
160
-
161
-
162
-
163
-
164
-
165
-
166
-
167
-
168
-
169
-
170
-
171
-
172
-
173
-
174
-
175
-
176
-
177
-
178
-
179
-
180
-
181
-
182
-
183
-
184
-
185
-
186
-
187
-
188
-
189
-
190
-
191
-
192
-
193
-
194
-
195
-
196
-
197
-
198
-
199
-
200
-
201
-
202
-
203
-
204
-
205
-
206
-
207
-
208
-
209
-
210
-
211
-
212
-
213
-
214
-
215
-
216
-
217
-
218
-
219
-
220
-
221
-
222
-
223
-
224
-
225
-
226
-
227
-
228
-
229
-
230
-
231
-
232
-
233
-
234
-
235
-
236
-
237
-
238
-
239
-
240
-
241
-
242
-
243
-
244
-
245
-
246
-
247
-
248
-
249
-
250
-
251
-
252
-
253
-
254
-
255
-
256
-
257
-
258
-
259
-
260
-
261
-
262
-
263
-
264
-
265
-
266
-
267
-
268
-
269
-
270
-
271
 |
 |

144
From March 2011, Japan’s economic development experienced a severe setback as a result of the
natural disaster and only made a slight recovery in the second half of the year. In a reversal from
the previous year’s strong growth of 4.4 percent, Japan’s economic output in 2011 as a whole fell
by 0.7 percent.
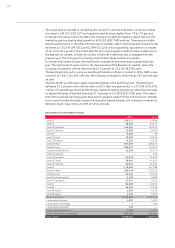
International car market
In line with general economic growth, global demand for cars in 2011 maintained the previous
year’s trend in continuing along the path to recovery and rose by 4.8 percent to a new record
level of 62.0 (59.1) million passenger cars. With the exception of Western Europe, all sales
regions shared in this growth. This development was promoted in particular by the Chinese,
Russian and U.S. markets.
By contrast, in Western Europe (excluding Germany) registrations of new cars amounted to
9.6 (10.1) million in the year under review, a decline of 4.5 percent. This was due on the one hand
to a weak first quarter in important volume markets, resulting primarily from the withdrawal of
state aid in the course of 2010. In addition, many countries experienced dwindling consumer
confidence, rising unemployment and restricted access to vehicle financing, all of which adversely
affected the market’s performance. Especially the major Western European car markets con-
tracted, in some cases markedly. While overall market demand in France and the UK was down
2.1 and 4.4 percent respectively, the Italian market shrank by 11.6 percent. Sales of passenger
cars in Spain tumbled by a further 17.7 percent from the already low prior-year figure.
There was an upward trend in demand for cars in most Central and Eastern European countries.
Particularly in Russia, the market moved up a gear compared with the previous year. Thanks to
state incentives for buyers and generally growing consumer confidence, sales of passenger cars
soared by 39.8 percent to 2.5 (1.8) million units.
Notwithstanding the U.S. economy’s loss of momentum in 2011, demand for automobiles in this
market showed an upward trend. At 12.8 (11.6) million passenger cars and light commercial
vehicles, unit sales were 10.3 percent up on the previous year. Along with the appearance of
new vehicle models, growing replacement demand provided a vital growth stimulus.
With 2.6 (2.6) million vehicles sold in Brazil, demand for automobiles in the biggest Latin
American car market remained unchanged from the previous year’s record level. In Argentina,
the market continued to grow strongly over the period under review. The sales volume there
gained 28.4 percent to reach a new record total of 0.6 (0.5) million passenger cars.
Markets in the Asia-Pacific region cooled down sharply in 2011 compared with the previous year.
With unit sales of 22.7 (22.1) million cars, the volume grew by only 2.5 percent. Within this trend,
the Chinese car market’s growth slipped to 7.6 percent, bringing total unit sales to 12.3 (11.5)
million passenger cars. This was mainly due to scaling back of state aid and was well below the
previous year’s growth of 35.1 percent. India’s car market, which had previously been experiencing
strong growth, was also weaker as a result of the high cost of financing and rising fuel prices,
growing by just 5.6 percent to 2.3 (2.2) million passenger cars. In Japan, new-car registrations
were badly affected by the aftermath of the natural disaster. Overall market volume fell by
16.3 percent in the period under review to 3.5 (4.2) million cars.
German car market
Despite higher fuel prices, 2011 saw the German car market recover from the previous year’s
sharp slump, rebounding by 8.8 percent to 3.2 (2.9) million passenger cars. The healthy overall
economic situation proved beneficial, prompting a rise in demand especially from business
customers.
The proportion of diesel versions in total new-car registrations had fallen sharply in 2009 due to
high consumer demand for gasoline models, which qualified for an environment bonus; diesels
have now been staging a recovery since 2010. The diesel proportion for 2011 as a whole was
47.1 percent, which equates to growth of 5.2 percentage points.