Audi 2011 Annual Report Download - page 222
Download and view the complete annual report
Please find page 222 of the 2011 Audi annual report below. You can navigate through the pages in the report by either clicking on the pages listed below, or by using the keyword search tool below to find specific information within the annual report.-
 1
1 -
2
-
3
-
4
-
5
-
6
-
7
-
8
-
9
-
10
-
11
-
12
-
13
-
14
-
15
-
16
-
17
-
18
-
19
-
20
-
21
-
22
-
23
-
24
-
25
-
26
-
27
-
28
-
29
-
30
-
31
-
32
-
33
-
34
-
35
-
36
-
37
-
38
-
39
-
40
-
41
-
42
-
43
-
44
-
45
-
46
-
47
-
48
-
49
-
50
-
51
-
52
-
53
-
54
-
55
-
56
-
57
-
58
-
59
-
60
-
61
-
62
-
63
-
64
-
65
-
66
-
67
-
68
-
69
-
70
-
71
-
72
-
73
-
74
-
75
-
76
-
77
-
78
-
79
-
80
-
81
-
82
-
83
-
84
-
85
-
86
-
87
-
88
-
89
-
90
-
91
-
92
-
93
-
94
-
95
-
96
-
97
-
98
-
99
-
100
-
101
-
102
-
103
-
104
-
105
-
106
-
107
-
108
-
109
-
110
-
111
-
112
-
113
-
114
-
115
-
116
-
117
-
118
-
119
-
120
-
121
-
122
-
123
-
124
-
125
-
126
-
127
-
128
-
129
-
130
-
131
-
132
-
133
-
134
-
135
-
136
-
137
-
138
-
139
-
140
-
141
-
142
-
143
-
144
-
145
-
146
-
147
-
148
-
149
-
150
-
151
-
152
-
153
-
154
-
155
-
156
-
157
-
158
-
159
-
160
-
161
-
162
-
163
-
164
-
165
-
166
-
167
-
168
-
169
-
170
-
171
-
172
-
173
-
174
-
175
-
176
-
177
-
178
-
179
-
180
-
181
-
182
-
183
-
184
-
185
-
186
-
187
-
188
-
189
-
190
-
191
-
192
-
193
-
194
-
195
-
196
-
197
-
198
-
199
-
200
-
201
-
202
-
203
-
204
-
205
-
206
-
207
-
208
-
209
-
210
-
211
-
 212
212 -
 213
213 -
 214
214 -
 215
215 -
 216
216 -
 217
217 -
 218
218 -
 219
219 -
 220
220 -
 221
221 -
 222
222 -
 223
223 -
 224
224 -
 225
225 -
 226
226 -
 227
227 -
 228
228 -
 229
229 -
 230
230 -
 231
231 -
 232
232 -
233
-
234
-
235
-
236
-
237
-
238
-
239
-
240
-
241
-
242
-
243
-
244
-
245
-
246
-
247
-
248
-
249
-
250
-
251
-
252
-
253
-
254
-
255
-
256
-
257
-
258
-
259
-
260
-
261
-
262
-
263
-
264
-
265
-
266
-
267
-
268
-
269
-
270
-
271
 |
 |

219
Consolidated Financial
Statements
188 Income Statement
189 Statement of Recognized
Income and Expense
190 Balance Sheet
191 Cash Flow Statement
192 Statement of Changes in Equity
Notes to the Consolidated
Financial Statements
194 Development of fixed assets
in the 2011 fiscal year
196 Development of fixed assets
in the 2010 fiscal year
198 General information
204 Recognition and
measurement principles
212 Notes to the Income Statement
218 Notes to the Balance Sheet
222 Liabilities
227 Additional disclosures
248 Events occurring subsequent
to the balance sheet date
249 Statement of Interests
held by the Audi Group
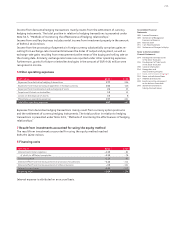
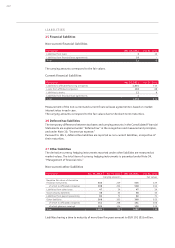
17 Other long-term investments
EUR million Dec. 31, 2011 Dec. 31, 2010
Investments in affiliated companies 143 106
Shares in associated companies and participating interests 100 73
Total 244 180
18 Deferred tax assets
The temporary differences between tax bases and carrying amounts in the Consolidated Financial
Statements are explained under “Deferred tax” in the recognition and measurement principles,
and under Note 10, “Income tax expense.”
19 Other receivables and other financial assets
Non-current other receivables and other financial assets
EUR million Dec. 31, 2011 Dec. 31, 2010
Loans advanced 131 96
of which to affiliated companies 130 95
Positive fair values of derivative financial instruments 236 417
of which to affiliated companies 152 362
Other tax assets 21
Other assets 44 45
Total 412 560
With regard to loans and other non-current assets, the fair values for 2011 correspond to the
carrying amounts. Loans advanced are subject to interest rates of up to 4.5 (4.5) percent.
Derivative financial instruments are measured at market value. The total position in relation to
hedging instruments is presented under Note 34.5, “Methods of monitoring the effectiveness
of hedging relationships.”
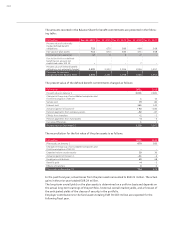
Current other receivables and other financial assets
EUR million Dec. 31, 2011 Dec. 31, 2010
Fixed deposits and loans extended 6,697 2,040
of which to affiliated companies 6,671 2,040
Positive fair values of derivative financial instruments 97 210
of which to affiliated companies 90 210
Other tax assets 157 135
Other receivables and assets 355 273
of which to affiliated companies 169 122
Total 7,307 2,658
All current other receivables and financial assets are due within one year of the balance sheet
date. The carrying amounts correspond to the fair values.
The positive fair values of derivative financial instruments are composed as follows:
EUR million Dec. 31, 2011 Dec. 31, 2010
Cash flow hedges to hedge against
currency risks from future payment streams 137 355
commodity price risks from future payment streams 38 125
Other derivative financial instruments 157 147
Positive fair values of derivative financial instruments 332 628