Audi 2011 Annual Report Download - page 235
Download and view the complete annual report
Please find page 235 of the 2011 Audi annual report below. You can navigate through the pages in the report by either clicking on the pages listed below, or by using the keyword search tool below to find specific information within the annual report.-
 1
1 -
2
-
3
-
4
-
5
-
6
-
7
-
8
-
9
-
10
-
11
-
12
-
13
-
14
-
15
-
16
-
17
-
18
-
19
-
20
-
21
-
22
-
23
-
24
-
25
-
26
-
27
-
28
-
29
-
30
-
31
-
32
-
33
-
34
-
35
-
36
-
37
-
38
-
39
-
40
-
41
-
42
-
43
-
44
-
45
-
46
-
47
-
48
-
49
-
50
-
51
-
52
-
53
-
54
-
55
-
56
-
57
-
58
-
59
-
60
-
61
-
62
-
63
-
64
-
65
-
66
-
67
-
68
-
69
-
70
-
71
-
72
-
73
-
74
-
75
-
76
-
77
-
78
-
79
-
80
-
81
-
82
-
83
-
84
-
85
-
86
-
87
-
88
-
89
-
90
-
91
-
92
-
93
-
94
-
95
-
96
-
97
-
98
-
99
-
100
-
101
-
102
-
103
-
104
-
105
-
106
-
107
-
108
-
109
-
110
-
111
-
112
-
113
-
114
-
115
-
116
-
117
-
118
-
119
-
120
-
121
-
122
-
123
-
124
-
125
-
126
-
127
-
128
-
129
-
130
-
131
-
132
-
133
-
134
-
135
-
136
-
137
-
138
-
139
-
140
-
141
-
142
-
143
-
144
-
145
-
146
-
147
-
148
-
149
-
150
-
151
-
152
-
153
-
154
-
155
-
156
-
157
-
158
-
159
-
160
-
161
-
162
-
163
-
164
-
165
-
166
-
167
-
168
-
169
-
170
-
171
-
172
-
173
-
174
-
175
-
176
-
177
-
178
-
179
-
180
-
181
-
182
-
183
-
184
-
185
-
186
-
187
-
188
-
189
-
190
-
191
-
192
-
193
-
194
-
195
-
196
-
197
-
198
-
199
-
200
-
201
-
202
-
203
-
204
-
205
-
206
-
207
-
208
-
209
-
210
-
211
-
212
-
213
-
214
-
215
-
216
-
217
-
218
-
219
-
220
-
221
-
222
-
223
-
224
-
 225
225 -
 226
226 -
 227
227 -
 228
228 -
 229
229 -
 230
230 -
 231
231 -
 232
232 -
 233
233 -
 234
234 -
 235
235 -
 236
236 -
 237
237 -
 238
238 -
 239
239 -
 240
240 -
 241
241 -
 242
242 -
 243
243 -
 244
244 -
 245
245 -
246
-
247
-
248
-
249
-
250
-
251
-
252
-
253
-
254
-
255
-
256
-
257
-
258
-
259
-
260
-
261
-
262
-
263
-
264
-
265
-
266
-
267
-
268
-
269
-
270
-
271
 |
 |

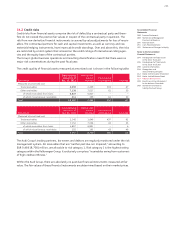
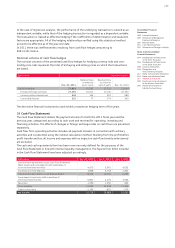
232
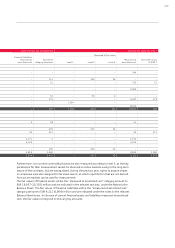
Reconciliation statement for financial instruments measured according to level 3
EUR million 2011 2010
Positive fair values of level 3 derivative financial instruments as of Jan. 1 71 55
Income and expense (–) recognized in the operating profit 34 56
Income and expense (–) recognized in the financial result 3 0
Income and expense (–) recognized in equity 27 4
Reclassification from level 3 to level 2 – 33 – 45
Positive fair values of level 3 derivative financial instruments as of Dec. 31 102 71
Income and expense (–) recognized in the operating profit from
level 3 derivative financial instruments still held at Dec. 31 34 56
Income and expense (–) recognized in the financial result from
level 3 derivative financial instruments still held at Dec. 31 – 1
Negative fair values of level 3 derivative financial instruments as of Jan. 1 – 127 – 224
Income and expense (–) recognized in the operating profit 11 43
Income and expense (–) recognized in the financial result – 17 – 2
Income and expense (–) recognized in equity 6 0
Realizations 83 55
Reclassification from level 3 to level 2 6 2
Negative fair values of level 3 derivative financial instruments as of Dec. 31 – 49 – 127
Income and expense (–) recognized in the operating profit from
level 3 derivative financial instruments still held at Dec. 31 14 43
Income and expense (–) recognized in the financial result from
level 3 derivative financial instruments still held at Dec. 31 11 –
The residual value hedging model is categorically allocated to level 3. The reclassifications from
level 3 to level 2 contain commodity futures for whose measurement it is no longer necessary to
extrapolate the exchange rates because these can now be observed again on the active market.
The effects of changes in the market price of used cars resulting from hedging arrangements are
shown in detail under Note 34.4, “Market risks.”
Risks resulting from fair value fluctuations in the derivative financial instruments measured
according to level 3 are calculated within the Audi Group by means of sensitivity analyses. In this
way, effects of changes in commodity price listings on profit and equity are shown. A 10 percent
rise (fall) in the commodity prices of commodity futures measured according to level 3 at
December 31, 2011 would impact on equity in the amount of EUR 12 (14) million. The effect on
profit of this rise (fall) would be EUR 11 (2) million.
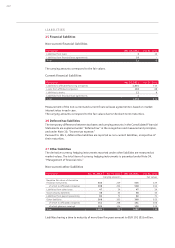
34 Management of financial risks
34.1 Hedging guidelines and principles of financial risk management
The principles and responsibilities involved in managing and controlling risks associated with
financial instruments are stipulated by the Board of Management in accordance with the
Volkswagen Group guidelines and statutory parameters, and monitored by the Supervisory
Board.
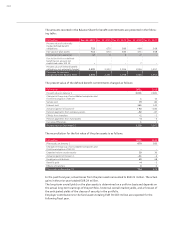
Operational risk management is carried out by the Group Treasury, as well as by AUDI AG and
Volkswagen AG, Wolfsburg. The Board of Management and Supervisory Board of AUDI AG are
regularly briefed on the current risk situation. Additionally, the Volkswagen Executive Committee
for Liquidity and Foreign Currency is regularly updated on the current financial risks.
Further details are provided in the Management Report on page 182.