Audi 2011 Annual Report Download - page 241
Download and view the complete annual report
Please find page 241 of the 2011 Audi annual report below. You can navigate through the pages in the report by either clicking on the pages listed below, or by using the keyword search tool below to find specific information within the annual report.-
 1
1 -
2
-
3
-
4
-
5
-
6
-
7
-
8
-
9
-
10
-
11
-
12
-
13
-
14
-
15
-
16
-
17
-
18
-
19
-
20
-
21
-
22
-
23
-
24
-
25
-
26
-
27
-
28
-
29
-
30
-
31
-
32
-
33
-
34
-
35
-
36
-
37
-
38
-
39
-
40
-
41
-
42
-
43
-
44
-
45
-
46
-
47
-
48
-
49
-
50
-
51
-
52
-
53
-
54
-
55
-
56
-
57
-
58
-
59
-
60
-
61
-
62
-
63
-
64
-
65
-
66
-
67
-
68
-
69
-
70
-
71
-
72
-
73
-
74
-
75
-
76
-
77
-
78
-
79
-
80
-
81
-
82
-
83
-
84
-
85
-
86
-
87
-
88
-
89
-
90
-
91
-
92
-
93
-
94
-
95
-
96
-
97
-
98
-
99
-
100
-
101
-
102
-
103
-
104
-
105
-
106
-
107
-
108
-
109
-
110
-
111
-
112
-
113
-
114
-
115
-
116
-
117
-
118
-
119
-
120
-
121
-
122
-
123
-
124
-
125
-
126
-
127
-
128
-
129
-
130
-
131
-
132
-
133
-
134
-
135
-
136
-
137
-
138
-
139
-
140
-
141
-
142
-
143
-
144
-
145
-
146
-
147
-
148
-
149
-
150
-
151
-
152
-
153
-
154
-
155
-
156
-
157
-
158
-
159
-
160
-
161
-
162
-
163
-
164
-
165
-
166
-
167
-
168
-
169
-
170
-
171
-
172
-
173
-
174
-
175
-
176
-
177
-
178
-
179
-
180
-
181
-
182
-
183
-
184
-
185
-
186
-
187
-
188
-
189
-
190
-
191
-
192
-
193
-
194
-
195
-
196
-
197
-
198
-
199
-
200
-
201
-
202
-
203
-
204
-
205
-
206
-
207
-
208
-
209
-
210
-
211
-
212
-
213
-
214
-
215
-
216
-
217
-
218
-
219
-
220
-
221
-
222
-
223
-
224
-
225
-
226
-
227
-
228
-
229
-
230
-
 231
231 -
 232
232 -
 233
233 -
 234
234 -
 235
235 -
 236
236 -
 237
237 -
 238
238 -
 239
239 -
 240
240 -
 241
241 -
 242
242 -
 243
243 -
 244
244 -
 245
245 -
 246
246 -
 247
247 -
 248
248 -
 249
249 -
 250
250 -
 251
251 -
252
-
253
-
254
-
255
-
256
-
257
-
258
-
259
-
260
-
261
-
262
-
263
-
264
-
265
-
266
-
267
-
268
-
269
-
270
-
271
 |
 |

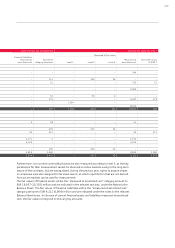
238
EUR million Dec. 31, 2011 Dec. 31, 2010
+ 10% – 10% + 10% – 10%
Currency relation
EUR/USD
Hedging provision 900 – 873 880 – 833
Profit after income taxes – 116 104 14 – 34
EUR/GBP
Hedging provision 331 – 331 229 – 229
Profit after income taxes 0 – 0 0 – 0
EUR/JPY
Hedging provision 184 – 184 89 – 89
Profit after income taxes 1 – 1 – 1 1
EUR/CNY
Hedging provision 150 – 150 – –
Profit after income taxes – 37 37 0 – 0
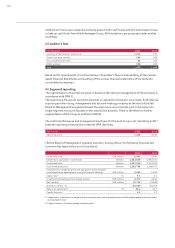
Quantifying other market risks by means of sensitivity analyses
The measurement of other market risks pursuant to IFRS 7 is also carried out using sensitivity
analyses in the Audi Group. Hypothetical changes to risk variables on the balance sheet date are
examined to calculate their impact on the corresponding Balance Sheet items and on the result.
Depending on the type of risk, there are various possible risk variables (primarily equity prices,
commodity prices, market interest rates, market prices of used cars). From the 2011 fiscal year
onward, the effect of changes to these factors is reported after taxes. The previous year’s figures
have been adjusted accordingly for the purposes of comparison.
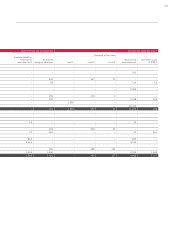
The sensitivity analyses carried out enabled the following other market risks to be quantified for
the Audi Group:
Data in 2011 2010
Fund price risks
Change in share prices Percent + 10 – 10 + 10 – 10
Effects on equity capital EUR million – 55 6 – 6
Commodity price risks
Change in commodity prices Percent + 10 – 10 + 10 – 10
Effects on equity capital EUR million 26 – 26 32 – 32
Effects on results EUR million 59 – 59 31 – 31
Interest rate change risks
Change in market interest rate Basis points + 100 – 100 + 100 – 100
Effects on equity capital EUR million 18 – 17 – 9 10
Effects on results EUR million 13 – 14 5 – 5
Residual value risks
Change in market prices of used cars Percent + 10 – 10 + 10 – 10
Effects on results EUR million 141 – 127 159 – 90
34.5 Methods of monitoring the effectiveness of hedging relationships
Within the Audi Group, the effectiveness of hedging relationships is evaluated prospectively
using the critical terms match method, as well as by means of statistical methods in the form of
a regression analysis. Retrospective evaluation of the effectiveness of hedges involves an effective-
ness test in the form of the dollar offset method or in the form of a regression analysis.
In the case of the dollar offset method, the changes in value of the underlying transaction,
expressed in monetary units, are compared with the changes in value of the hedge, expressed
in monetary units. All hedge relationships were effective within the range specified in IAS 39
(80 to 125 percent).