Audi 2011 Annual Report Download - page 228
Download and view the complete annual report
Please find page 228 of the 2011 Audi annual report below. You can navigate through the pages in the report by either clicking on the pages listed below, or by using the keyword search tool below to find specific information within the annual report.-
 1
1 -
2
-
3
-
4
-
5
-
6
-
7
-
8
-
9
-
10
-
11
-
12
-
13
-
14
-
15
-
16
-
17
-
18
-
19
-
20
-
21
-
22
-
23
-
24
-
25
-
26
-
27
-
28
-
29
-
30
-
31
-
32
-
33
-
34
-
35
-
36
-
37
-
38
-
39
-
40
-
41
-
42
-
43
-
44
-
45
-
46
-
47
-
48
-
49
-
50
-
51
-
52
-
53
-
54
-
55
-
56
-
57
-
58
-
59
-
60
-
61
-
62
-
63
-
64
-
65
-
66
-
67
-
68
-
69
-
70
-
71
-
72
-
73
-
74
-
75
-
76
-
77
-
78
-
79
-
80
-
81
-
82
-
83
-
84
-
85
-
86
-
87
-
88
-
89
-
90
-
91
-
92
-
93
-
94
-
95
-
96
-
97
-
98
-
99
-
100
-
101
-
102
-
103
-
104
-
105
-
106
-
107
-
108
-
109
-
110
-
111
-
112
-
113
-
114
-
115
-
116
-
117
-
118
-
119
-
120
-
121
-
122
-
123
-
124
-
125
-
126
-
127
-
128
-
129
-
130
-
131
-
132
-
133
-
134
-
135
-
136
-
137
-
138
-
139
-
140
-
141
-
142
-
143
-
144
-
145
-
146
-
147
-
148
-
149
-
150
-
151
-
152
-
153
-
154
-
155
-
156
-
157
-
158
-
159
-
160
-
161
-
162
-
163
-
164
-
165
-
166
-
167
-
168
-
169
-
170
-
171
-
172
-
173
-
174
-
175
-
176
-
177
-
178
-
179
-
180
-
181
-
182
-
183
-
184
-
185
-
186
-
187
-
188
-
189
-
190
-
191
-
192
-
193
-
194
-
195
-
196
-
197
-
198
-
199
-
200
-
201
-
202
-
203
-
204
-
205
-
206
-
207
-
208
-
209
-
210
-
211
-
212
-
213
-
214
-
215
-
216
-
217
-
 218
218 -
 219
219 -
 220
220 -
 221
221 -
 222
222 -
 223
223 -
 224
224 -
 225
225 -
 226
226 -
 227
227 -
 228
228 -
 229
229 -
 230
230 -
 231
231 -
 232
232 -
 233
233 -
 234
234 -
 235
235 -
 236
236 -
 237
237 -
 238
238 -
239
-
240
-
241
-
242
-
243
-
244
-
245
-
246
-
247
-
248
-
249
-
250
-
251
-
252
-
253
-
254
-
255
-
256
-
257
-
258
-
259
-
260
-
261
-
262
-
263
-
264
-
265
-
266
-
267
-
268
-
269
-
270
-
271
 |
 |

225
Consolidated Financial
Statements
188 Income Statement
189 Statement of Recognized
Income and Expense
190 Balance Sheet
191 Cash Flow Statement
192 Statement of Changes in Equity
Notes to the Consolidated
Financial Statements
194 Development of fixed assets
in the 2011 fiscal year
196 Development of fixed assets
in the 2010 fiscal year
198 General information
204 Recognition and
measurement principles
212 Notes to the Income Statement
218 Notes to the Balance Sheet
222 Liabilities
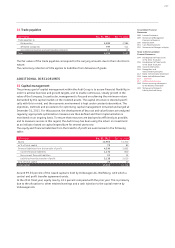
227 Additional disclosures
248 Events occurring subsequent
to the balance sheet date
249 Statement of Interests
held by the Audi Group
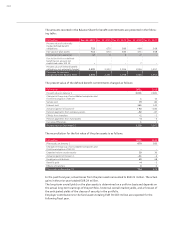
The composition of fund assets is as follows, by category:
as % of fund assets 2011 2010
Shares 28.6 31.2
Fixed-income securities 62.2 42.4
Cash 4.4 9.3
Real estate 2.6 3.1
Other 2.2 14.0
Total 100.0 100.0
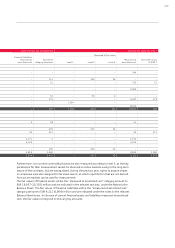
Actuarial gains and losses result from changes in the entitlement base and from deviations in
the actual trends (e.g. increases in pay or retirement benefits) from the figures assumed for
calculation purposes. In accordance with the requirements of IAS 19, such gains and losses are
recognized without affecting income under a separate line item within equity, taking deferred
tax into account.
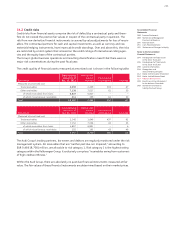
The following amounts were recognized in the Income Statement:
EUR million 2011 2010
Current service cost for services provided by the employees in the fiscal year – 79 – 80
Interest cost – 141 – 142
Expected return on plan assets 29 30
Total – 191 – 192
The interest element in pension costs is shown under financing costs. The expected return on
plan assets is also shown under this item.
The provisions for pensions recognized in the Balance Sheet are determined by offsetting the
present value against the fund assets pursuant to IAS 19. The development of the net liability
recognized as provisions for pensions was as follows:
EUR million 2011 2010
Provisions for pensions on January 1 2,331 2,098
Changes in the group of consolidated companies and
first-time adoption of IAS 19 112
Employee benefit expenses 191 192
Actuarial gains (–)/losses (+) + 143 + 186
Pension payments from company assets – 92 – 87
Contributions paid to external pension funds – 69 – 68
Effects from transfers – 1– 2
Currency differences 11
Provisions for pensions on December 31 2,505 2,331
The experience-based adjustments, i.e. the effects of differences between actuarial assumptions
and what has actually transpired, are presented in the following table:
% 2011 2010 2009 2008 2007
Difference between anticipated and actual performance
as % of the present value of the obligation 0.88 – 0.31 1.37 0.17 – 1.46
as % of fair value of plan assets – 7.12 0.84 – 4.86 – 9.88 – 5.26