Audi 2011 Annual Report Download - page 163
Download and view the complete annual report
Please find page 163 of the 2011 Audi annual report below. You can navigate through the pages in the report by either clicking on the pages listed below, or by using the keyword search tool below to find specific information within the annual report.-
 1
1 -
2
-
3
-
4
-
5
-
6
-
7
-
8
-
9
-
10
-
11
-
12
-
13
-
14
-
15
-
16
-
17
-
18
-
19
-
20
-
21
-
22
-
23
-
24
-
25
-
26
-
27
-
28
-
29
-
30
-
31
-
32
-
33
-
34
-
35
-
36
-
37
-
38
-
39
-
40
-
41
-
42
-
43
-
44
-
45
-
46
-
47
-
48
-
49
-
50
-
51
-
52
-
53
-
54
-
55
-
56
-
57
-
58
-
59
-
60
-
61
-
62
-
63
-
64
-
65
-
66
-
67
-
68
-
69
-
70
-
71
-
72
-
73
-
74
-
75
-
76
-
77
-
78
-
79
-
80
-
81
-
82
-
83
-
84
-
85
-
86
-
87
-
88
-
89
-
90
-
91
-
92
-
93
-
94
-
95
-
96
-
97
-
98
-
99
-
100
-
101
-
102
-
103
-
104
-
105
-
106
-
107
-
108
-
109
-
110
-
111
-
112
-
113
-
114
-
115
-
116
-
117
-
118
-
119
-
120
-
121
-
122
-
123
-
124
-
125
-
126
-
127
-
128
-
129
-
130
-
131
-
132
-
133
-
134
-
135
-
136
-
137
-
138
-
139
-
140
-
141
-
142
-
143
-
144
-
145
-
146
-
147
-
148
-
149
-
150
-
151
-
152
-
 153
153 -
 154
154 -
 155
155 -
 156
156 -
 157
157 -
 158
158 -
 159
159 -
 160
160 -
 161
161 -
 162
162 -
 163
163 -
 164
164 -
 165
165 -
 166
166 -
 167
167 -
 168
168 -
 169
169 -
 170
170 -
 171
171 -
 172
172 -
 173
173 -
174
-
175
-
176
-
177
-
178
-
179
-
180
-
181
-
182
-
183
-
184
-
185
-
186
-
187
-
188
-
189
-
190
-
191
-
192
-
193
-
194
-
195
-
196
-
197
-
198
-
199
-
200
-
201
-
202
-
203
-
204
-
205
-
206
-
207
-
208
-
209
-
210
-
211
-
212
-
213
-
214
-
215
-
216
-
217
-
218
-
219
-
220
-
221
-
222
-
223
-
224
-
225
-
226
-
227
-
228
-
229
-
230
-
231
-
232
-
233
-
234
-
235
-
236
-
237
-
238
-
239
-
240
-
241
-
242
-
243
-
244
-
245
-
246
-
247
-
248
-
249
-
250
-
251
-
252
-
253
-
254
-
255
-
256
-
257
-
258
-
259
-
260
-
261
-
262
-
263
-
264
-
265
-
266
-
267
-
268
-
269
-
270
-
271
 |
 |

160
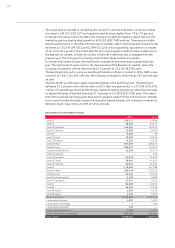
As a result of the dynamic business performance, the cost of sales for the Audi Group rose to
EUR 36,000 (29,706) million in the period under review. Thanks to ongoing improvements in
productivity and processes, this increase of 21.2 percent was below the rate of increase in revenue.
The Audi Group’s gross profit thus climbed 41.2 percent to EUR 8,096 (5,735) million.
Distribution costs rose to EUR 3,599 (3,038) million, above all as a result of the marked increase
in volume, the costs incurred in connection with the introduction of new models and the first-time
consolidation of a number of companies. Administrative expenses increased to EUR 429 (374)
million. The other operating result rose to EUR 1,280 (1,017) million in 2011.
The Audi Group thus improved its operating profit for the past fiscal year by 60.1 percent overall,
to EUR 5,348 (3,340) million. This new record figure means the Company continues to make
impressive progress down the growth pathway envisaged in its Strategy 2020.
The financial result was improved to EUR 692 (293) million in the past fiscal year. The substantial
increase is above all due to effects from the measurement of hedging transactions as well as to
higher interest and similar income. Furthermore, there was a rise in the result from investments
accounted for using the equity method thanks to another positive set of business figures for the
joint venture FAW-Volkswagen Automotive Company, Ltd., Changchun (China).
In all, the Audi Group therefore improved its profit before tax by 66.2 percent to EUR 6,041
(3,634) million. After deduction of income tax expense, the Company posted a profit of EUR
4,440 (2,630) million for the period under review, a rise of 68.8 percent.
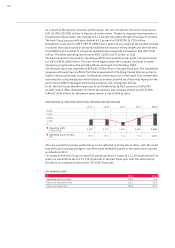
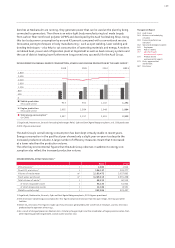
DEVELOPMENT OF OPERATING PROFIT AND OPERATING RETURN ON SALES
6,000
200920082007
4,500
3,000
1,500
0
Operating profit
(EUR million)
Operating return on sales
(%)
5,348
12.1
1,604
5.4
2,772
8.1
2,705
8.0
20112010
3,340
9.4
The very successful business performance is also reflected in all key return ratios, with the result
that the Audi Group was yet again one of the most profitable players in the automotive industry
worldwide in 2011.
For example, the Audi Group increased its operating return on sales to 12.1 (9.4) percent and its
return on sales before tax to 13.7 (10.3) percent in the past fiscal year. Over the same period,
the return on investment improved to 35.4 (24.7) percent.
KEY EARNINGS DATA
% 2011 2010
Operating return on sales 12.1 9.4
Return on sales before tax 13.7 10.3
Return on investment 35.4 24.7