Audi 2011 Annual Report Download - page 172
Download and view the complete annual report
Please find page 172 of the 2011 Audi annual report below. You can navigate through the pages in the report by either clicking on the pages listed below, or by using the keyword search tool below to find specific information within the annual report.-
 1
1 -
2
-
3
-
4
-
5
-
6
-
7
-
8
-
9
-
10
-
11
-
12
-
13
-
14
-
15
-
16
-
17
-
18
-
19
-
20
-
21
-
22
-
23
-
24
-
25
-
26
-
27
-
28
-
29
-
30
-
31
-
32
-
33
-
34
-
35
-
36
-
37
-
38
-
39
-
40
-
41
-
42
-
43
-
44
-
45
-
46
-
47
-
48
-
49
-
50
-
51
-
52
-
53
-
54
-
55
-
56
-
57
-
58
-
59
-
60
-
61
-
62
-
63
-
64
-
65
-
66
-
67
-
68
-
69
-
70
-
71
-
72
-
73
-
74
-
75
-
76
-
77
-
78
-
79
-
80
-
81
-
82
-
83
-
84
-
85
-
86
-
87
-
88
-
89
-
90
-
91
-
92
-
93
-
94
-
95
-
96
-
97
-
98
-
99
-
100
-
101
-
102
-
103
-
104
-
105
-
106
-
107
-
108
-
109
-
110
-
111
-
112
-
113
-
114
-
115
-
116
-
117
-
118
-
119
-
120
-
121
-
122
-
123
-
124
-
125
-
126
-
127
-
128
-
129
-
130
-
131
-
132
-
133
-
134
-
135
-
136
-
137
-
138
-
139
-
140
-
141
-
142
-
143
-
144
-
145
-
146
-
147
-
148
-
149
-
150
-
151
-
152
-
153
-
154
-
155
-
156
-
157
-
158
-
159
-
160
-
161
-
 162
162 -
 163
163 -
 164
164 -
 165
165 -
 166
166 -
 167
167 -
 168
168 -
 169
169 -
 170
170 -
 171
171 -
 172
172 -
 173
173 -
 174
174 -
 175
175 -
 176
176 -
 177
177 -
 178
178 -
 179
179 -
 180
180 -
 181
181 -
 182
182 -
183
-
184
-
185
-
186
-
187
-
188
-
189
-
190
-
191
-
192
-
193
-
194
-
195
-
196
-
197
-
198
-
199
-
200
-
201
-
202
-
203
-
204
-
205
-
206
-
207
-
208
-
209
-
210
-
211
-
212
-
213
-
214
-
215
-
216
-
217
-
218
-
219
-
220
-
221
-
222
-
223
-
224
-
225
-
226
-
227
-
228
-
229
-
230
-
231
-
232
-
233
-
234
-
235
-
236
-
237
-
238
-
239
-
240
-
241
-
242
-
243
-
244
-
245
-
246
-
247
-
248
-
249
-
250
-
251
-
252
-
253
-
254
-
255
-
256
-
257
-
258
-
259
-
260
-
261
-
262
-
263
-
264
-
265
-
266
-
267
-
268
-
269
-
270
-
271
 |
 |
169
Management Report
134 Audi Group
143 Business and underlying
situation
159 Financial performance
indicators
162 Social and ecological aspects
162 Employees
166 Audi in society
167 Location-based
environmental aspects
170 Product-based
environmental aspects
175 Risks, opportunities
and outlook
187 Disclaimer
benches at Neckarsulm are running, they generate power that can be used at the plant by being
connected to generators. Then there is an extra-light body manufacturing tool made largely
from carbon fiber-reinforced polymer (CFRP) and developed by the Audi Toolmaking Shop. Using
this tool cuts power consumption by around 43 percent compared with a conventional version.
Innovative joining techniques in body manufacturing – such as spot welding, laser welding and
bonding techniques – also help to cut consumption of operating materials and energy. A modern
combined heat, power and refrigeration plant at Ingolstadt as well as heat recovery systems and
the use of district heating have furthermore long proved very successful for the Audi Group.
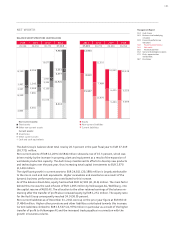
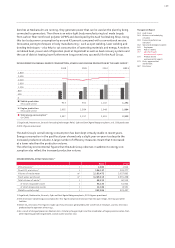
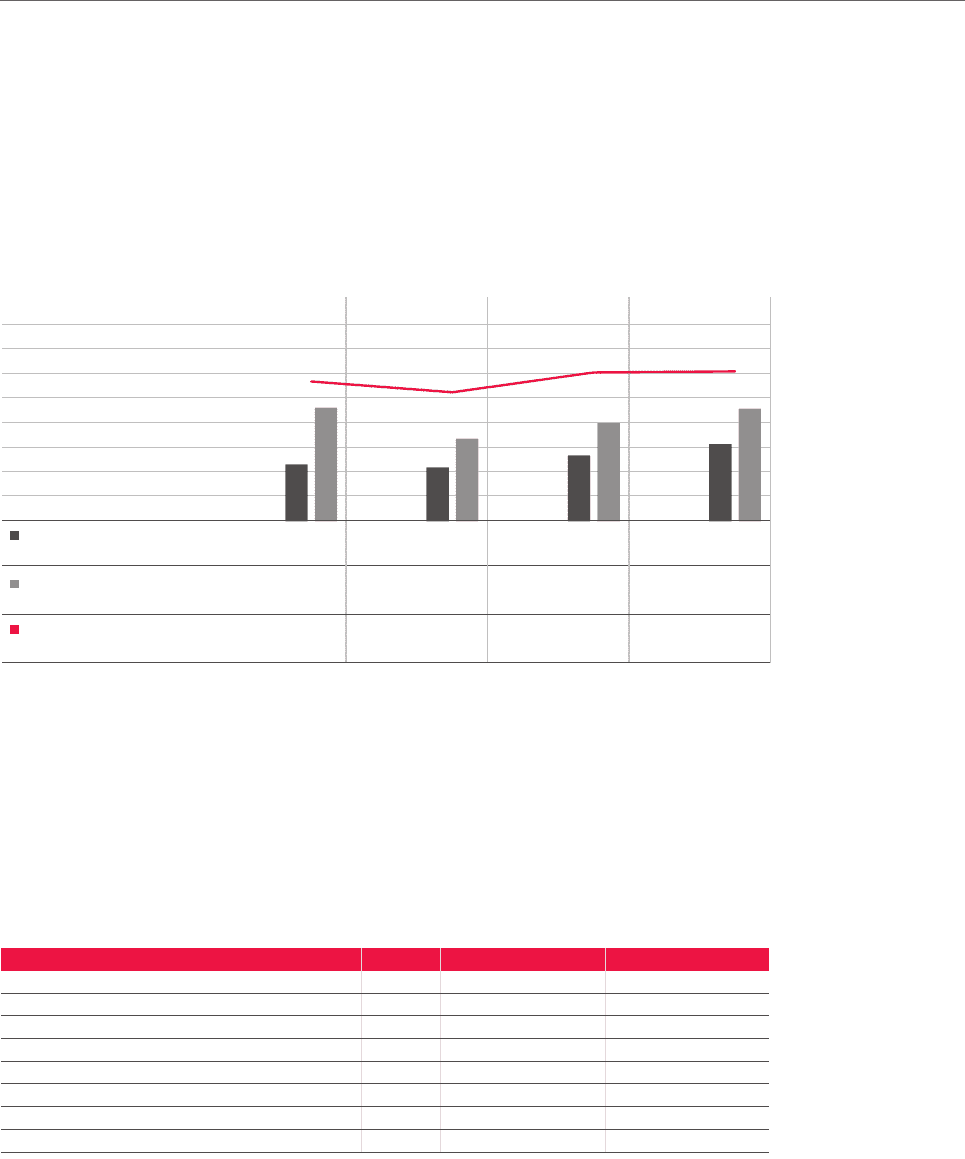
DEVELOPMENT IN OVERALL ENERGY CONSUMPTION, VEHICLE AND ENGINE PRODUCTION BY THE AUDI GROUP 1)
Vehicle production
(thousand units)
Engine production
(thousand units)
1,102
1,648
2,491
Total energy consumption
(in GWh)
800
400
0
2011201020092008
2,400
2,000
1,600
1,200
2,800
1,292
1,884
2,509
953
1,902
2,337
902
1,384
2,157
2)
1) Ingolstadt, Neckarsulm, Brussels (excluding Volkswagen Polo), Győr and Sant’Agata Bolognese plants; incl. CKD production
2) 2011 figures provisional
The Audi Group’s overall energy consumption has been kept virtually stable in recent years.
Energy consumption in the past fiscal year showed only a slight year-on-year rise despite the
increased production volume. A large number of efficiency measures meant that it increased
at a lower rate than the production volume.
The other key environmental figures that the Audi Group observes in addition to energy con-
sumption also reflect the increased production volume.
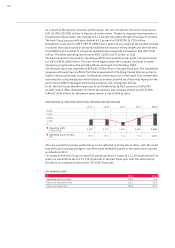
ENVIRONMENTAL STRUCTURAL DATA 1)
2011 2010
VOC emissions 2) t 2,380 1,913
Direct CO2 emissions 3) t 196,137 203,277
Volume of waste water m³ 2,180,472 2,057,863
Fresh water purchased m³ 3,229,515 2,991,498
Total volume of waste 4) t 68,312 60,513
of which recyclable waste t56,130 51,922
of which disposable waste t12,182 8,591
Metallic waste (scrap) t335,286 323,497
1) Ingolstadt, Neckarsulm, Brussels, Győr and Sant’Agata Bolognese plants; 2011 figures provisional
2) VOC emissions (volatile organic compounds): This figure comprises emissions from the paint shops, test rigs and other
facilities.
3) Direct CO₂ emissions: This figure is made up of CO₂ emissions generated by the use of fuel at the plant, and CO₂ emissions
produced by the operation of test rigs.
4) As a result of changed processes (Neckarsulm), statutory changes (Győr) and the remediation of legacy contamination from
other reporting periods (Ingolstadt), overall waste volumes rose.