Audi 2011 Annual Report Download - page 164
Download and view the complete annual report
Please find page 164 of the 2011 Audi annual report below. You can navigate through the pages in the report by either clicking on the pages listed below, or by using the keyword search tool below to find specific information within the annual report.-
 1
1 -
2
-
3
-
4
-
5
-
6
-
7
-
8
-
9
-
10
-
11
-
12
-
13
-
14
-
15
-
16
-
17
-
18
-
19
-
20
-
21
-
22
-
23
-
24
-
25
-
26
-
27
-
28
-
29
-
30
-
31
-
32
-
33
-
34
-
35
-
36
-
37
-
38
-
39
-
40
-
41
-
42
-
43
-
44
-
45
-
46
-
47
-
48
-
49
-
50
-
51
-
52
-
53
-
54
-
55
-
56
-
57
-
58
-
59
-
60
-
61
-
62
-
63
-
64
-
65
-
66
-
67
-
68
-
69
-
70
-
71
-
72
-
73
-
74
-
75
-
76
-
77
-
78
-
79
-
80
-
81
-
82
-
83
-
84
-
85
-
86
-
87
-
88
-
89
-
90
-
91
-
92
-
93
-
94
-
95
-
96
-
97
-
98
-
99
-
100
-
101
-
102
-
103
-
104
-
105
-
106
-
107
-
108
-
109
-
110
-
111
-
112
-
113
-
114
-
115
-
116
-
117
-
118
-
119
-
120
-
121
-
122
-
123
-
124
-
125
-
126
-
127
-
128
-
129
-
130
-
131
-
132
-
133
-
134
-
135
-
136
-
137
-
138
-
139
-
140
-
141
-
142
-
143
-
144
-
145
-
146
-
147
-
148
-
149
-
150
-
151
-
152
-
153
-
 154
154 -
 155
155 -
 156
156 -
 157
157 -
 158
158 -
 159
159 -
 160
160 -
 161
161 -
 162
162 -
 163
163 -
 164
164 -
 165
165 -
 166
166 -
 167
167 -
 168
168 -
 169
169 -
 170
170 -
 171
171 -
 172
172 -
 173
173 -
 174
174 -
175
-
176
-
177
-
178
-
179
-
180
-
181
-
182
-
183
-
184
-
185
-
186
-
187
-
188
-
189
-
190
-
191
-
192
-
193
-
194
-
195
-
196
-
197
-
198
-
199
-
200
-
201
-
202
-
203
-
204
-
205
-
206
-
207
-
208
-
209
-
210
-
211
-
212
-
213
-
214
-
215
-
216
-
217
-
218
-
219
-
220
-
221
-
222
-
223
-
224
-
225
-
226
-
227
-
228
-
229
-
230
-
231
-
232
-
233
-
234
-
235
-
236
-
237
-
238
-
239
-
240
-
241
-
242
-
243
-
244
-
245
-
246
-
247
-
248
-
249
-
250
-
251
-
252
-
253
-
254
-
255
-
256
-
257
-
258
-
259
-
260
-
261
-
262
-
263
-
264
-
265
-
266
-
267
-
268
-
269
-
270
-
271
 |
 |

161
Management Report
134 Audi Group
143 Business and underlying
situation
159 Financial performance
indicators
159 Financial performance
161 Net worth
162 Financial position
162 Social and ecological aspects
175 Risks, opportunities
and outlook
187 Disclaimer
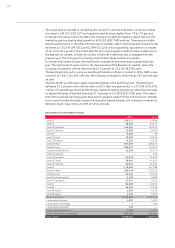
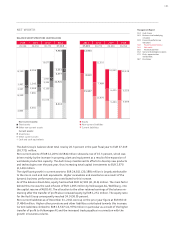
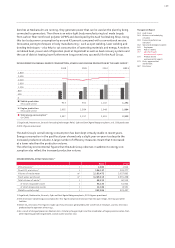
NET WORTH
BALANCE SHEET STRUCTURE (EUR MILLION)
2011201020092008 2008200920102011
37,019 26,550 26,05626,55026,056 30,772 37,019 30,772
Fixed assets
Other non-current assets
Inventories
Other current assets
Cash and cash equivalents
Equity
Non-current liabilities
Current liabilities
1,347
3,347
8,339
4,833
8,296
1,340
2,568
7,890
6,455
10,632
6,425
9,493
9,958
2,251
4,377
8,513
11,921
12,903
8,610
15,507
Non-current assets:
Current assets:
8,190
8,677
1,907
3,354
10,724
6,109
10,328
6,029
9,699
11,310
7,484
11,979
The Audi Group’s balance sheet total rose by 20.3 percent in the past fiscal year to EUR 37,019
(30,772) million.
Non-current assets of EUR 12,209 (10,584) million showed a rise of 15.3 percent, which was
driven mainly by the increase in property, plant and equipment as a result of the expansion of
worldwide production capacity. The Audi Group maintained its efforts to develop new products
and technologies over the past year, thus increasing total capital investments to EUR 2,970
(2,146) million.
The significant growth in current assets to EUR 24,811 (20,188) million is largely attributable
to the rise in cash and cash equivalents. Higher receivables and inventories as a result of the
dynamic business performance also contributed to this increase.
As of the balance sheet date, equity had reached EUR 12,903 (11,310) million. The main factor
behind this rise was the cash infusion of EUR 1,005 million by Volkswagen AG, Wolfsburg, into
the capital reserve of AUDI AG. The allocation to the other retained earnings of the balance re-
maining after the transfer of profit also increased equity by EUR 1,251 million. The equity ratio
for the Audi Group consequently reached 34.9 (36.8) percent.
Non-current liabilities as of December 31, 2011 were up on the prior-year figure at EUR 8,610
(7,484) million. Higher other provisions and other liabilities contributed towards this increase.
Current liabilities climbed to EUR 15,507 (11,979) million in particular as a result of the higher
transfer of profit to Volkswagen AG and the increased trade payables in connection with the
growth in business volume.