Audi 2011 Annual Report Download - page 248
Download and view the complete annual report
Please find page 248 of the 2011 Audi annual report below. You can navigate through the pages in the report by either clicking on the pages listed below, or by using the keyword search tool below to find specific information within the annual report.-
 1
1 -
2
-
3
-
4
-
5
-
6
-
7
-
8
-
9
-
10
-
11
-
12
-
13
-
14
-
15
-
16
-
17
-
18
-
19
-
20
-
21
-
22
-
23
-
24
-
25
-
26
-
27
-
28
-
29
-
30
-
31
-
32
-
33
-
34
-
35
-
36
-
37
-
38
-
39
-
40
-
41
-
42
-
43
-
44
-
45
-
46
-
47
-
48
-
49
-
50
-
51
-
52
-
53
-
54
-
55
-
56
-
57
-
58
-
59
-
60
-
61
-
62
-
63
-
64
-
65
-
66
-
67
-
68
-
69
-
70
-
71
-
72
-
73
-
74
-
75
-
76
-
77
-
78
-
79
-
80
-
81
-
82
-
83
-
84
-
85
-
86
-
87
-
88
-
89
-
90
-
91
-
92
-
93
-
94
-
95
-
96
-
97
-
98
-
99
-
100
-
101
-
102
-
103
-
104
-
105
-
106
-
107
-
108
-
109
-
110
-
111
-
112
-
113
-
114
-
115
-
116
-
117
-
118
-
119
-
120
-
121
-
122
-
123
-
124
-
125
-
126
-
127
-
128
-
129
-
130
-
131
-
132
-
133
-
134
-
135
-
136
-
137
-
138
-
139
-
140
-
141
-
142
-
143
-
144
-
145
-
146
-
147
-
148
-
149
-
150
-
151
-
152
-
153
-
154
-
155
-
156
-
157
-
158
-
159
-
160
-
161
-
162
-
163
-
164
-
165
-
166
-
167
-
168
-
169
-
170
-
171
-
172
-
173
-
174
-
175
-
176
-
177
-
178
-
179
-
180
-
181
-
182
-
183
-
184
-
185
-
186
-
187
-
188
-
189
-
190
-
191
-
192
-
193
-
194
-
195
-
196
-
197
-
198
-
199
-
200
-
201
-
202
-
203
-
204
-
205
-
206
-
207
-
208
-
209
-
210
-
211
-
212
-
213
-
214
-
215
-
216
-
217
-
218
-
219
-
220
-
221
-
222
-
223
-
224
-
225
-
226
-
227
-
228
-
229
-
230
-
231
-
232
-
233
-
234
-
235
-
236
-
237
-
 238
238 -
 239
239 -
 240
240 -
 241
241 -
 242
242 -
 243
243 -
 244
244 -
 245
245 -
 246
246 -
 247
247 -
 248
248 -
 249
249 -
 250
250 -
 251
251 -
 252
252 -
 253
253 -
 254
254 -
 255
255 -
 256
256 -
 257
257 -
 258
258 -
259
-
260
-
261
-
262
-
263
-
264
-
265
-
266
-
267
-
268
-
269
-
270
-
271
 |
 |

245
Consolidated Financial
Statements
188 Income Statement
189 Statement of Recognized
Income and Expense
190 Balance Sheet
191 Cash Flow Statement
192 Statement of Changes in Equity
Notes to the Consolidated
Financial Statements
194 Development of fixed assets
in the 2011 fiscal year
196 Development of fixed assets
in the 2010 fiscal year
198 General information
204 Recognition and
measurement principles
212 Notes to the Income Statement
218 Notes to the Balance Sheet
227 Additional disclosures
248 Events occurring subsequent
to the balance sheet date
249 Statement of Interests
held by the Audi Group
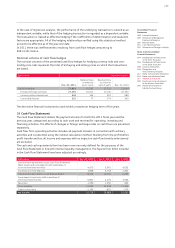
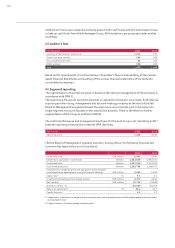
Investment and depreciation and amortization developed as follows:
EUR million 2011 2010
Investments in property, plant and equipment and intangible assets 2,285 1,449
Additions of capitalized development work 596 630
Long-term investments 89 67
Total 2,970 2,146
EUR million 2011 2010
Impairment losses on property, plant and equipment and intangible assets 1,395 1,542
Amortization of capitalized development work 397 626
Impairment losses on long-term investments –1
Depreciation of leased assets 11
Total 1,793 2,170
The Audi Group primarily generates revenues from the sale of cars. In addition to the Audi brand,
sales also comprise vehicles of the Lamborghini brand and vehicles of the other brands in the
Volkswagen Group.
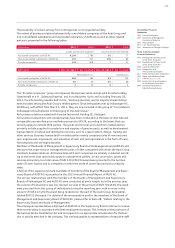
EUR million 2011 2010
Audi brand 34,456 27,423
Lamborghini brand 268 227
Volkswagen brand 2,991 2,611
SEAT brand 204 189
Škoda brand 226 235
Bentley brand 23 11
Vehicle sales 38,168 30,697
Other car business 5,928 4,744
Revenue 44,096 35,441
The Audi Group, through Volkswagen AG, Wolfsburg, and also through the affiliated companies
of the VW Group, has key accounts with whom there exists a relationship of dependence:
Revenue with key accounts 2011 2010
EUR million %EUR million %
Volkswagen AG, Wolfsburg 3,684 8.4 3,156 8.9
Affiliated companies of the Volkswagen Group excluding
fully consolidated companies of the Audi Group 9,877 22.4 7,747 21.9
The Audi Group’s revenue was generated in the following regions:
Sales revenues by region 2011 2010
EUR million %EUR million %
Germany 9,212 20.9 8,546 24.1
Rest of Europe 16,814 38.1 15,017 42.4
Asia-Pacific 12,127 27.5 7,044 19.9
North America 5,003 11.3 4,125 11.6
South America 550 1.2 371 1.0
Africa 389 0.9 337 1.0
Total 44,096 100.0 35,441 100.0