Audi 2011 Annual Report Download - page 231
Download and view the complete annual report
Please find page 231 of the 2011 Audi annual report below. You can navigate through the pages in the report by either clicking on the pages listed below, or by using the keyword search tool below to find specific information within the annual report.-
 1
1 -
2
-
3
-
4
-
5
-
6
-
7
-
8
-
9
-
10
-
11
-
12
-
13
-
14
-
15
-
16
-
17
-
18
-
19
-
20
-
21
-
22
-
23
-
24
-
25
-
26
-
27
-
28
-
29
-
30
-
31
-
32
-
33
-
34
-
35
-
36
-
37
-
38
-
39
-
40
-
41
-
42
-
43
-
44
-
45
-
46
-
47
-
48
-
49
-
50
-
51
-
52
-
53
-
54
-
55
-
56
-
57
-
58
-
59
-
60
-
61
-
62
-
63
-
64
-
65
-
66
-
67
-
68
-
69
-
70
-
71
-
72
-
73
-
74
-
75
-
76
-
77
-
78
-
79
-
80
-
81
-
82
-
83
-
84
-
85
-
86
-
87
-
88
-
89
-
90
-
91
-
92
-
93
-
94
-
95
-
96
-
97
-
98
-
99
-
100
-
101
-
102
-
103
-
104
-
105
-
106
-
107
-
108
-
109
-
110
-
111
-
112
-
113
-
114
-
115
-
116
-
117
-
118
-
119
-
120
-
121
-
122
-
123
-
124
-
125
-
126
-
127
-
128
-
129
-
130
-
131
-
132
-
133
-
134
-
135
-
136
-
137
-
138
-
139
-
140
-
141
-
142
-
143
-
144
-
145
-
146
-
147
-
148
-
149
-
150
-
151
-
152
-
153
-
154
-
155
-
156
-
157
-
158
-
159
-
160
-
161
-
162
-
163
-
164
-
165
-
166
-
167
-
168
-
169
-
170
-
171
-
172
-
173
-
174
-
175
-
176
-
177
-
178
-
179
-
180
-
181
-
182
-
183
-
184
-
185
-
186
-
187
-
188
-
189
-
190
-
191
-
192
-
193
-
194
-
195
-
196
-
197
-
198
-
199
-
200
-
201
-
202
-
203
-
204
-
205
-
206
-
207
-
208
-
209
-
210
-
211
-
212
-
213
-
214
-
215
-
216
-
217
-
218
-
219
-
220
-
 221
221 -
 222
222 -
 223
223 -
 224
224 -
 225
225 -
 226
226 -
 227
227 -
 228
228 -
 229
229 -
 230
230 -
 231
231 -
 232
232 -
 233
233 -
 234
234 -
 235
235 -
 236
236 -
 237
237 -
 238
238 -
 239
239 -
 240
240 -
 241
241 -
242
-
243
-
244
-
245
-
246
-
247
-
248
-
249
-
250
-
251
-
252
-
253
-
254
-
255
-
256
-
257
-
258
-
259
-
260
-
261
-
262
-
263
-
264
-
265
-
266
-
267
-
268
-
269
-
270
-
271
 |
 |

228
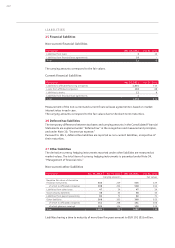
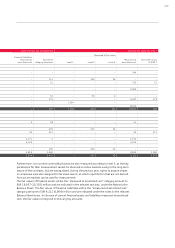
33 Additional disclosures on financial instruments in the Balance Sheet
Carrying amounts of financial instruments
The following table presents a reconciliation of the carrying amounts of the Balance Sheet items with
the individual IFRS 7 categories:
EUR million
Carrying amount
as per Balance
Sheet as of
Dec. 31, 2011
Measured at fair
value through
profit or loss Available for sale
Loans and
receivables
ASSETS
Non-current
Other long-term investments 246 – 246 –
Other receivables and assets 410
of which from positive fair values of derivative financial instruments 236 124 – –
of which miscellaneous other receivables and assets 174 – –153
Current
Trade receivables 3,009 – –3,009
Other receivables and assets 7,307
of which from positive fair values of derivative financial instruments 97 45 – –
of which miscellaneous other receivables and assets 7,210 – –6,937
Securities 1,594 – 1,594 –
Cash and cash equivalents 8,513 – –8,513
Total financial assets 21,078 169 1,840 18,612
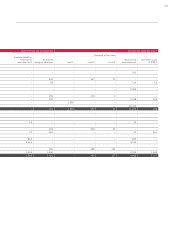
LIABILITIES AND SHAREHOLDERS’ EQUITY
Non-current
Financial liabilities 21 – – –
Other liabilities 1,080
of which from negative fair values of derivative financial instruments 545 55 – –
of which miscellaneous other liabilities 535 – – –
Current
Financial liabilities 1,172 – – –
Trade payables 4,193 – – –
Other liabilities 6,355
of which from negative fair values of derivative financial instruments 461 71 – –
of which miscellaneous other liabilities 5,894 – – –
Total financial liabilities 12,821 126 – –
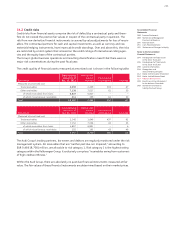
Measurement of financial instruments at fair value is based on a three-level hierarchy and on the
proximity of the measurement factors used to an active market. An active market is one in which
homogenous products are traded, where willing buyers and sellers can be found for them at all
times, and where their prices are publicly available.
Level 1 involves the measurement of financial instruments, such as securities, listed on active
markets.
Level 2 involves the measurement of financial instruments such as derivatives based on market-
related, recognized financial valuation models, where the measurement factors, such as exchange
rates or interest rates, can be observed directly or indirectly on active markets.
In the Audi Group, level 3 mainly covers residual value hedging arrangements with the retail trade.
The input factors for measuring the future development of used car prices cannot be observed
on active markets; they are forecasted by various independent institutions. The residual value
hedging model is explained in Note 34.4, “Market risks.”