Audi 2011 Annual Report Download - page 215
Download and view the complete annual report
Please find page 215 of the 2011 Audi annual report below. You can navigate through the pages in the report by either clicking on the pages listed below, or by using the keyword search tool below to find specific information within the annual report.-
 1
1 -
2
-
3
-
4
-
5
-
6
-
7
-
8
-
9
-
10
-
11
-
12
-
13
-
14
-
15
-
16
-
17
-
18
-
19
-
20
-
21
-
22
-
23
-
24
-
25
-
26
-
27
-
28
-
29
-
30
-
31
-
32
-
33
-
34
-
35
-
36
-
37
-
38
-
39
-
40
-
41
-
42
-
43
-
44
-
45
-
46
-
47
-
48
-
49
-
50
-
51
-
52
-
53
-
54
-
55
-
56
-
57
-
58
-
59
-
60
-
61
-
62
-
63
-
64
-
65
-
66
-
67
-
68
-
69
-
70
-
71
-
72
-
73
-
74
-
75
-
76
-
77
-
78
-
79
-
80
-
81
-
82
-
83
-
84
-
85
-
86
-
87
-
88
-
89
-
90
-
91
-
92
-
93
-
94
-
95
-
96
-
97
-
98
-
99
-
100
-
101
-
102
-
103
-
104
-
105
-
106
-
107
-
108
-
109
-
110
-
111
-
112
-
113
-
114
-
115
-
116
-
117
-
118
-
119
-
120
-
121
-
122
-
123
-
124
-
125
-
126
-
127
-
128
-
129
-
130
-
131
-
132
-
133
-
134
-
135
-
136
-
137
-
138
-
139
-
140
-
141
-
142
-
143
-
144
-
145
-
146
-
147
-
148
-
149
-
150
-
151
-
152
-
153
-
154
-
155
-
156
-
157
-
158
-
159
-
160
-
161
-
162
-
163
-
164
-
165
-
166
-
167
-
168
-
169
-
170
-
171
-
172
-
173
-
174
-
175
-
176
-
177
-
178
-
179
-
180
-
181
-
182
-
183
-
184
-
185
-
186
-
187
-
188
-
189
-
190
-
191
-
192
-
193
-
194
-
195
-
196
-
197
-
198
-
199
-
200
-
201
-
202
-
203
-
204
-
 205
205 -
 206
206 -
 207
207 -
 208
208 -
 209
209 -
 210
210 -
 211
211 -
 212
212 -
 213
213 -
 214
214 -
 215
215 -
 216
216 -
 217
217 -
 218
218 -
 219
219 -
 220
220 -
 221
221 -
 222
222 -
 223
223 -
 224
224 -
 225
225 -
226
-
227
-
228
-
229
-
230
-
231
-
232
-
233
-
234
-
235
-
236
-
237
-
238
-
239
-
240
-
241
-
242
-
243
-
244
-
245
-
246
-
247
-
248
-
249
-
250
-
251
-
252
-
253
-
254
-
255
-
256
-
257
-
258
-
259
-
260
-
261
-
262
-
263
-
264
-
265
-
266
-
267
-
268
-
269
-
270
-
271
 |
 |

212
NOTES TO THE INCOME STATEMENT
1 Revenue
The composition of the revenue of the Group, by brand, is as follows:
EUR million 2011 2010
Audi brand 34,456 27,423
Lamborghini brand 268 227
Other Volkswagen Group brands 3,444 3,047
Vehicle sales 38,168 30,697
Other car business 5,928 4,744
Revenue 44,096 35,441
Vehicle revenue includes proceeds from the Audi Group from the sale of vehicles of the Audi
and Lamborghini brands as well as of other brands of the Volkswagen Group.
Revenue from other car business primarily includes proceeds from the sale of engines and
genuine parts.
2 Cost of sales
Amounting to EUR 36,000 (29,706) million, cost of sales comprises the costs incurred in gene-
rating revenue and purchase prices in trading transactions. This item also includes expenses
resulting from the formation of provisions for warranty costs, for development costs that cannot
be capitalized, for scheduled and unscheduled amortization of capitalized development costs, and
for property, plant and equipment for manufacturing purposes. Cost of sales includes unsched-
uled impairment losses on intangible assets and property, plant and equipment amounting to
EUR 93 (463) million. The impairment losses were recorded on the basis of updated impairment
tests and took particular account of market risks and exchange rate risks.
3 Distribution costs
Distribution costs of EUR 3,599 (3,038) million substantially comprise labor and materials costs
for marketing and sales promotion, advertising, public relations activities and outward freight,
as well as depreciation attributable to the sales organization.
4 Administrative expenses
Administrative expenses of EUR 429 (374) million include labor and materials costs, as well as
depreciation attributable to administrative operations.
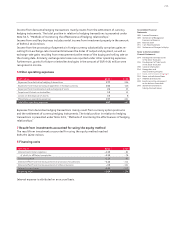
5 Other operating income
EUR million 2011 2010
Income from derivative hedging transactions 369 297
Income from rebilling 368 379
Income from the dissolution of provisions 278 174
Income from the processing of payments in foreign currency 233 181
Income from ancillary business 188 162
Income from the write-up of intangible assets – 58
Income from the disposal of assets 9 6
Income from the reversal of reductions for impairment on receivables and
other assets 6 3
Miscellaneous operating income 516 423
Total other operating income 1,967 1,684