Audi 2011 Annual Report Download - page 232
Download and view the complete annual report
Please find page 232 of the 2011 Audi annual report below. You can navigate through the pages in the report by either clicking on the pages listed below, or by using the keyword search tool below to find specific information within the annual report.-
 1
1 -
2
-
3
-
4
-
5
-
6
-
7
-
8
-
9
-
10
-
11
-
12
-
13
-
14
-
15
-
16
-
17
-
18
-
19
-
20
-
21
-
22
-
23
-
24
-
25
-
26
-
27
-
28
-
29
-
30
-
31
-
32
-
33
-
34
-
35
-
36
-
37
-
38
-
39
-
40
-
41
-
42
-
43
-
44
-
45
-
46
-
47
-
48
-
49
-
50
-
51
-
52
-
53
-
54
-
55
-
56
-
57
-
58
-
59
-
60
-
61
-
62
-
63
-
64
-
65
-
66
-
67
-
68
-
69
-
70
-
71
-
72
-
73
-
74
-
75
-
76
-
77
-
78
-
79
-
80
-
81
-
82
-
83
-
84
-
85
-
86
-
87
-
88
-
89
-
90
-
91
-
92
-
93
-
94
-
95
-
96
-
97
-
98
-
99
-
100
-
101
-
102
-
103
-
104
-
105
-
106
-
107
-
108
-
109
-
110
-
111
-
112
-
113
-
114
-
115
-
116
-
117
-
118
-
119
-
120
-
121
-
122
-
123
-
124
-
125
-
126
-
127
-
128
-
129
-
130
-
131
-
132
-
133
-
134
-
135
-
136
-
137
-
138
-
139
-
140
-
141
-
142
-
143
-
144
-
145
-
146
-
147
-
148
-
149
-
150
-
151
-
152
-
153
-
154
-
155
-
156
-
157
-
158
-
159
-
160
-
161
-
162
-
163
-
164
-
165
-
166
-
167
-
168
-
169
-
170
-
171
-
172
-
173
-
174
-
175
-
176
-
177
-
178
-
179
-
180
-
181
-
182
-
183
-
184
-
185
-
186
-
187
-
188
-
189
-
190
-
191
-
192
-
193
-
194
-
195
-
196
-
197
-
198
-
199
-
200
-
201
-
202
-
203
-
204
-
205
-
206
-
207
-
208
-
209
-
210
-
211
-
212
-
213
-
214
-
215
-
216
-
217
-
218
-
219
-
220
-
221
-
 222
222 -
 223
223 -
 224
224 -
 225
225 -
 226
226 -
 227
227 -
 228
228 -
 229
229 -
 230
230 -
 231
231 -
 232
232 -
 233
233 -
 234
234 -
 235
235 -
 236
236 -
 237
237 -
 238
238 -
 239
239 -
 240
240 -
 241
241 -
 242
242 -
243
-
244
-
245
-
246
-
247
-
248
-
249
-
250
-
251
-
252
-
253
-
254
-
255
-
256
-
257
-
258
-
259
-
260
-
261
-
262
-
263
-
264
-
265
-
266
-
267
-
268
-
269
-
270
-
271
 |
 |
229
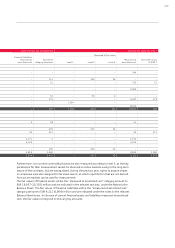
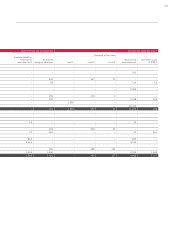
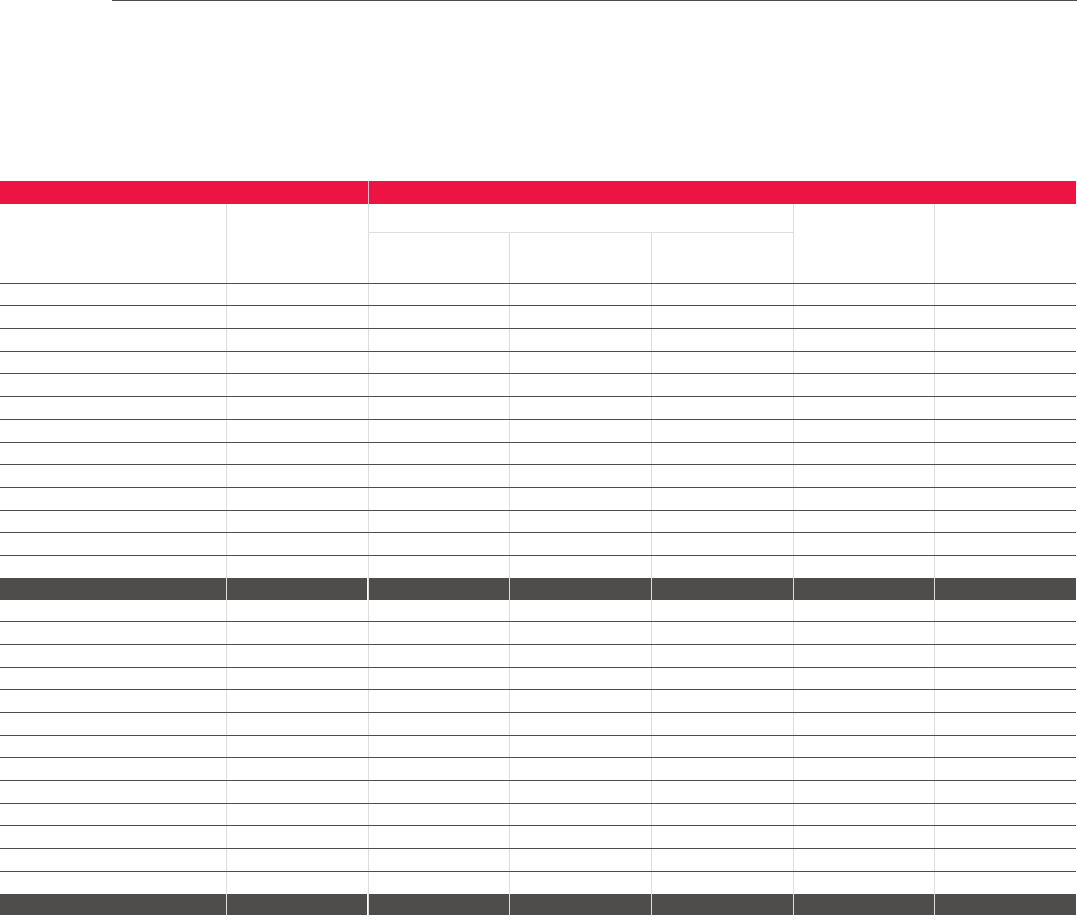
Assignment to IAS 39 categories Division into classes of IFRS 7
Financial liabilities
measured at
amortized cost
No IAS 39
category allocated
Measured at fair value
Measured at
amortized cost
Not under scope
of IFRS 7
Level 1 Level 2 Level 3
– – – – – 246 –
– 111 –140 96 – –
– 21 – – – 153 21
– – – – – 3,009 –
– 51 –90 6– –
– 273 – – – 6,937 273
– –1,594 – – – –
– – – – – 8,513 –
– 457 1,594 230 102 18,857 294
3 18 – – – 21 –
– 491 –521 24 – –
24 511 – – – 24 511
1,171 1 – – – 1,172 –
4,193 – – – – 4,193 –
– 390 –436 25 – –
3,813 2,082 – – – 3,813 2,082
9,204 3,492 –957 49 9,222 2,593
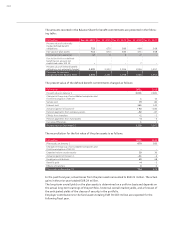
Furthermore, non-current commodity futures are also measured according to level 3, as the key
parameters for their measurement cannot be observed on active markets owing to the long-term
nature of the contracts, but are extrapolated. During the previous year, rights to acquire shares
in companies were also assigned to fair value level 3, at which input factors that are not derived
from active markets can be used for measurement.
The fair values of financial assets within the “measured at amortized cost” category amount to
EUR 18,857 (15,355) million and are indicated in the relevant sections, under the Notes to the
Balance Sheet. The fair values of financial liabilities within the “measured at amortized cost”
category amount to EUR 9,222 (6,864) million and are indicated under the notes to the relevant
Balance Sheet items. In the case of current financial assets and liabilities measured at amortized
cost, the fair values correspond to the carrying amounts.