Audi 2011 Annual Report Download - page 218
Download and view the complete annual report
Please find page 218 of the 2011 Audi annual report below. You can navigate through the pages in the report by either clicking on the pages listed below, or by using the keyword search tool below to find specific information within the annual report.-
 1
1 -
2
-
3
-
4
-
5
-
6
-
7
-
8
-
9
-
10
-
11
-
12
-
13
-
14
-
15
-
16
-
17
-
18
-
19
-
20
-
21
-
22
-
23
-
24
-
25
-
26
-
27
-
28
-
29
-
30
-
31
-
32
-
33
-
34
-
35
-
36
-
37
-
38
-
39
-
40
-
41
-
42
-
43
-
44
-
45
-
46
-
47
-
48
-
49
-
50
-
51
-
52
-
53
-
54
-
55
-
56
-
57
-
58
-
59
-
60
-
61
-
62
-
63
-
64
-
65
-
66
-
67
-
68
-
69
-
70
-
71
-
72
-
73
-
74
-
75
-
76
-
77
-
78
-
79
-
80
-
81
-
82
-
83
-
84
-
85
-
86
-
87
-
88
-
89
-
90
-
91
-
92
-
93
-
94
-
95
-
96
-
97
-
98
-
99
-
100
-
101
-
102
-
103
-
104
-
105
-
106
-
107
-
108
-
109
-
110
-
111
-
112
-
113
-
114
-
115
-
116
-
117
-
118
-
119
-
120
-
121
-
122
-
123
-
124
-
125
-
126
-
127
-
128
-
129
-
130
-
131
-
132
-
133
-
134
-
135
-
136
-
137
-
138
-
139
-
140
-
141
-
142
-
143
-
144
-
145
-
146
-
147
-
148
-
149
-
150
-
151
-
152
-
153
-
154
-
155
-
156
-
157
-
158
-
159
-
160
-
161
-
162
-
163
-
164
-
165
-
166
-
167
-
168
-
169
-
170
-
171
-
172
-
173
-
174
-
175
-
176
-
177
-
178
-
179
-
180
-
181
-
182
-
183
-
184
-
185
-
186
-
187
-
188
-
189
-
190
-
191
-
192
-
193
-
194
-
195
-
196
-
197
-
198
-
199
-
200
-
201
-
202
-
203
-
204
-
205
-
206
-
207
-
 208
208 -
 209
209 -
 210
210 -
 211
211 -
 212
212 -
 213
213 -
 214
214 -
 215
215 -
 216
216 -
 217
217 -
 218
218 -
 219
219 -
 220
220 -
 221
221 -
 222
222 -
 223
223 -
 224
224 -
 225
225 -
 226
226 -
 227
227 -
 228
228 -
229
-
230
-
231
-
232
-
233
-
234
-
235
-
236
-
237
-
238
-
239
-
240
-
241
-
242
-
243
-
244
-
245
-
246
-
247
-
248
-
249
-
250
-
251
-
252
-
253
-
254
-
255
-
256
-
257
-
258
-
259
-
260
-
261
-
262
-
263
-
264
-
265
-
266
-
267
-
268
-
269
-
270
-
271
 |
 |
215
Consolidated Financial
Statements
188 Income Statement
189 Statement of Recognized
Income and Expense
190 Balance Sheet
191 Cash Flow Statement
192 Statement of Changes in Equity
Notes to the Consolidated
Financial Statements
194 Development of fixed assets
in the 2011 fiscal year
196 Development of fixed assets
in the 2010 fiscal year
198 General information
204 Recognition and
measurement principles
212 Notes to the Income Statement
218 Notes to the Balance Sheet
227 Additional disclosures
248 Events occurring subsequent
to the balance sheet date
249 Statement of Interests
held by the Audi Group
There are loss carryforwards totaling EUR 114 (135) million, of which the amount of
EUR 99 (50) million can be used indefinitely. In the 2011 fiscal year, the realization of tax
losses led to a reduction in current income tax expense of EUR 5 (1) million. Deferred tax assets
of EUR 2 (10) million relating to carryforward of unused tax losses were not reported due to
impairment.
Of the deferred taxes reported in the Balance Sheet, a total of EUR 317 (190) million was recorded
with a resulting increase in equity, without influencing the Income Statement. The recording of
actuarial gains and losses without affecting income, pursuant to IAS 19, led in the current fiscal
year to an increase in equity of EUR 42 (55) million from the creation of deferred taxes. The change
in deferred taxes on the effects for derivative financial instruments and securities recognized in
equity led to a rise of EUR 275 (135) million in equity.
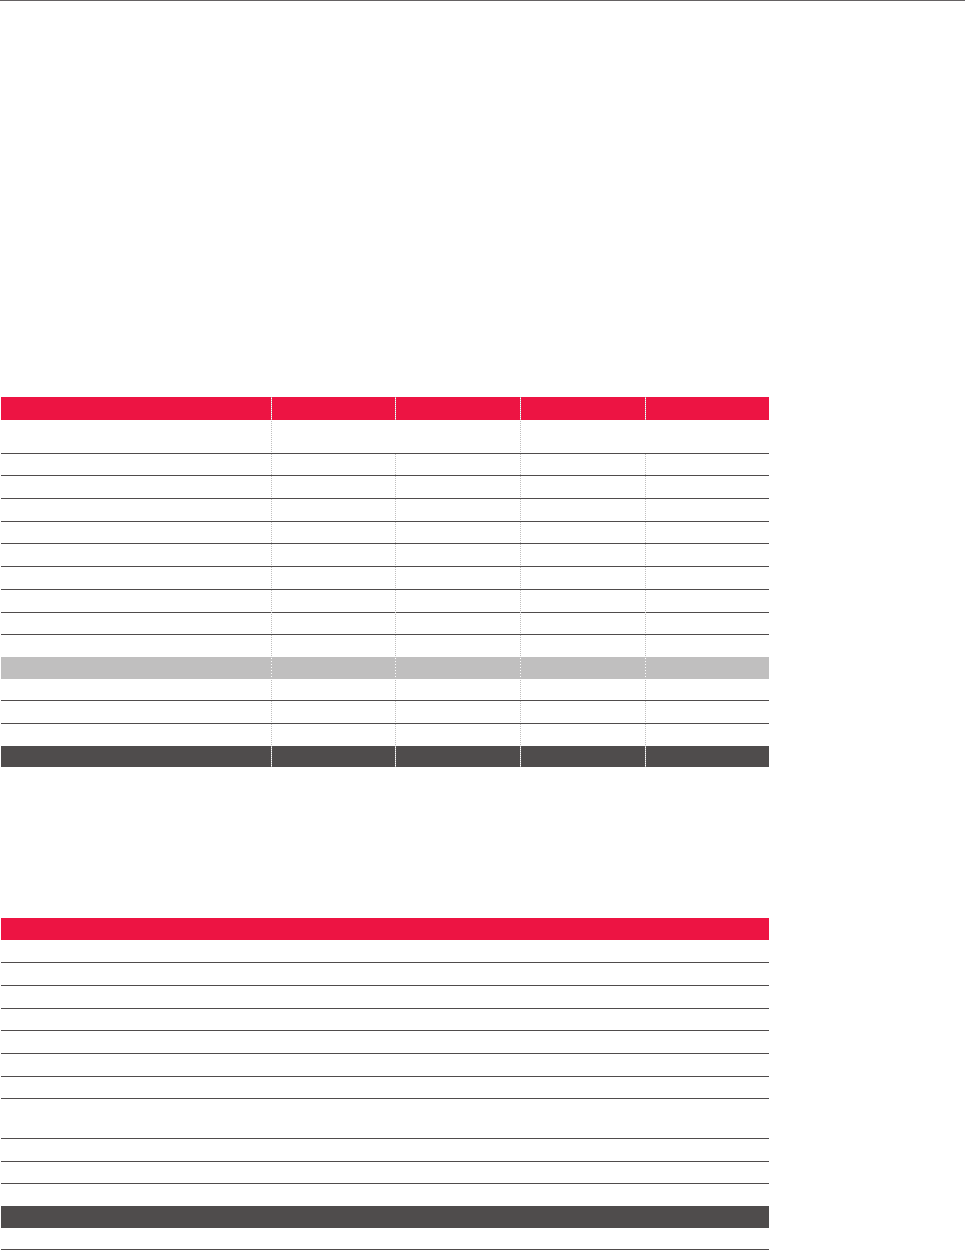
The reporting and measurement differences in the individual Balance Sheet items can be attri-
buted to the following deferred tax assets and liabilities carried in the Balance Sheet:
EUR million Dec. 31, 2011 Dec. 31, 2010 Dec. 31, 2011 Dec. 31, 2010
Deferred tax assets Deferred tax liabilities
Intangible assets 56 112 515 524
Property, plant and equipment 198 365 70 235
Long-term investments 2158 –1
Inventories 38 64 136
Receivables and other assets 193 179 39 230
Other current assets 15 73 ––
Provisions for pensions 165 140 33
Liabilities and other provisions 1,583 1,089 94
Loss carryforwards 27 27 ––
Gross value 2,277 2,207 637 1,032
of which non-current 1,280 1,458 596 685
Offsetting measures – 621 – 1,010 – 621 – 1,010
Consolidation measures 183 150 ––
Carrying amount 1,839 1,347 16 22
Reconciliation of anticipated and reported income tax expense
The anticipated tax expense is higher than the reported tax expense. The reasons for the differ-
ence between the anticipated and the reported tax expense can be found in the reconciliation
accounts as follows:
EUR million 2011 2010
Profit before tax 6,041 3,634
Anticipated income tax expense 29.5% (29.5%) 1,782 1,072
Reconciliation:
Divergent foreign tax burden – 29 – 38
Tax portion for:
tax-exempt income – 243 – 277
expenses not deductible for tax purposes 10 27
temporary differences and losses for which no deferred tax
has been recorded 30 207
Non-periodic tax expenses 50
Effects of tax rate changes – 41 34
Other tax effects 87 – 21
Income tax expense reported 1,601 1,004
Effective tax rate in % 26.5 27.6